


1. Background
In recent years, various factors have contributed to a substantial rise in healthcare costs (1). These increases have created a growing financial burden for societies worldwide. However, less developed countries are particularly affected by these rising costs due to their restricted financial resources, making it nearly impossible for them to provide all essential health services (2). In 2019, national health spending in the United States rose by 4.6 percent, which brought the healthcare sector's share of the gross national product (GNP) to 17.7 percent (3). While the amount and percentage of health expenditures differ across countries, they tend to be lower in developing and less developed nations. Nonetheless, these expenditures create a considerable financial burden for those countries (4). Research conducted in Iran indicates that in 2019, the country’s health expenditure represented approximately 0.6% of global spending and around 6.7% of its gross domestic product (GDP) (5).
Using an appropriate payment system is a crucial strategy for managing costs within the health system (6). It serves as one of the most important levers for controlling overall expenses. Additionally, ensuring the quality of services is a key criterion when selecting a payment system. This, combined with the essential goal of cost control, plays a significant role in enhancing people's health.
Payment systems fall into two categories: Prospective and retrospective. These include fee-for-service (FFS), per capita, payment per day of hospitalization, payment per patient, and payments based on related diagnostic groups (7). Among the payment methods, the FFS system is a typical approach to reimbursing service providers. In this system, payments are determined by the quantity of services rendered to patients. This model closely resembles a free market compared to other payment systems. Its advantages include improved service quality and greater satisfaction for service recipients. However, a significant drawback of this payment method is the potential increase in health system costs. This issue arises from induced demand from either the patient or the service provider (8).
To reduce health costs associated with induced demand and to better manage overall health system expenses, prospective payment methods have been suggested (9). One potential method is case payment, where service providers receive a fixed fee for each patient admitted, based on the type of illness, regardless of the length of stay or services provided (10). In this context, diagnosis-related groups (DRGs) were initially developed in the 1970s by researchers at Yale University (11). The DRGs classify patients into groups based on similar hospital costs (12). This payment method is now recognized as the primary form of payment in many countries (13).
Since 1999, Iran's Ministry of Health, Treatment, and Medical Education has localized the American DRG system and implemented a global payment method for 60 surgical procedures. Over the years, this list has expanded, and there are now approximately 91 global surgical procedures (14).
In implementing the Global Plan, policymakers have aimed to reduce the time taken by insurance organizations to process hospital bills, improve hospitals’ resource management, and optimize the duration of patient hospitalization (15).
Given that global surgeries account for a major share of procedures in public hospitals, this payment method can impact hospital and insurance performance, affecting overall patient care, insurance companies, and the health system as a whole (16).
Accordingly, in the event that the cost of any component of the services provided to the patient exceeds the standard considered in global surgical procedures, providers may incur losses. Similarly, if the standard considered in the global tariff exceeds the actual price of these procedures, insurance organizations may face financial losses (15).
2. Objectives
Therefore, considering the importance of controlling hospital costs in the health system and the impact of tariffs and costs of global surgeries on the performance of hospitals and insurance organizations, this study was conducted with the aim of comparing the costs of surgeries performed using two methods: Global and FFS in hospitals affiliated with Bushehr University of Medical Sciences. The objective was to determine and compare the actual costs (costs incurred based on the FFS system) of surgical procedures and their global costs. Evidence of the impact and consequences of the global payment method will be provided to policymakers and hospital management, thereby helping them implement targeted tariff interventions and control hospital costs.
3. Methods
3.1. Study Setting and Design
This is a cross-sectional, retrospective, and descriptive-analytic study that simultaneously compares the cost of a group of surgical procedures known as global ones with two payment methods, including FFS and global, in Bushehr province, Iran, in 2022. This study was conducted on 8 university hospitals affiliated with Bushehr University of Medical Sciences. The hospitals participating in this study included the Persian Gulf Hospital (280 beds), Shahid Ganji Hospital (241 beds), Zeinabiyeh Hospital (93 beds), Amir al-Momenin Hospital (103 beds), Imam Khomeini Hospital (120 beds), Baqiyatollah Hospital (46 beds), Imam Hassan Hospital (28 beds), and Imam Hadi Hospital (31 beds).
3.2. Population and Sampling
The study population consisted of all medical records of patients who had global surgery in 2022. A total of 12,527 cases were analyzed.
3.3. Data Collection
The data required for this study were obtained from the hospital information system (HIS). After ensuring the quality of the data through multiple checks, they were entered into Excel and SPSS software. The data included demographic information such as age, gender, type of insurance, nationality, and the number of days spent in the hospital. Additionally, the study's cost analysis incorporated global tariffs (determined by the Supreme Council of Insurance) and the costs of surgical procedures based on the FFS method (determined by summing cost items recorded in the patient’s bill).
3.4. Data Analysis
In this study, 15 global surgery operations that had the highest frequency and covered about 90 percent of all surgeries were examined separately. In addition, all global procedures were divided into eight groups (based on the service delivery departments) including: Obstetrics and cesarean sections, gynecological surgery (other than cesarean sections), general surgery, orthopedics, ENT, urology, ophthalmology, and neurology.
Then, for all 15 global surgery operations and eight departments studied, the frequency, total bill cost, total global tariff, related averages, and benefits/losses (difference between global tariff and bill cost) were calculated separately for two groups: Profitable and unprofitable. An independent t-test at the 0.05 significance level was used to determine the significance of the difference between global tariffs and bill costs for all studied surgery operations, departments, and demographic variables.
4. Results
4.1. Findings Related to Demographic Variables
The findings indicate that 83.3 percent of those who underwent global procedures in 2022 were men, and the number of women was about one-fifth of that of men. The majority of patients had insurance coverage, while only 1.4 percent were uninsured. The median age of those who underwent global activities was 31.7 years. About 69 percent of the physicians were full-time, and the rest had a part-time relationship with the hospitals (Table 1).
| Variables | N (%) | Mean of Patient Bill | Mean of Global Tariff | P-Value |
|---|---|---|---|---|
| Insurance | < 0.0001 | |||
| Social security | 4921 (39.3) | 41277770 | 39288417 | |
| Iran health insurance | 4439 (35.4) | 41442650 | 38701806 | |
| Armed forces | 528 (4.2) | 44381059 | 40862928 | |
| Other | 2458 (19.6) | 36708127 | 32910327 | |
| No insurance | 181 (1.4) | - | - | |
| Sex | < 0.0001 | |||
| Male | 10439 (83.3) | 41655544 | 38447935 | |
| Female | 2088 (16.7) | 34749007 | 34579869 | |
| Nationality | < 0.0001 | |||
| Iranian | 10731(85.66) | 41259570 | 38626013 | |
| Non-Iranian | 1789 (14.31) | 36157206 | 32830492 | |
| Type of physician contract | < 0.0001 | |||
| Full time | 4024 (31) | 44620931 | 40175063 | |
| Part time | 8493 (69) | 38567264 | 36695926 | |
| Mean of hospitalization days | - | 1.28 | 2.32 | < 0.0001 |
Demographic Information of Patients Undergoing Global Procedures in 2022 in Hospitals Affiliated with Bushehr University of Medical Sciences
According to Table 2, during the year 2022, 12,527 global procedures were performed in all the hospitals studied. The highest proportion of these procedures was conducted at the Persian Gulf Martyrs Hospital, which accounted for 28.4 percent of the total, followed by Imam Khomeini Hospital in Kangan, which accounted for 22.6 percent of global procedures. The lowest share was related to Ahram Hospital, with 33 procedures, accounting for about 0.26 percent of procedures. The findings also demonstrate that, in aggregate, all hospitals incurred a loss of 33,851,636,586 rials due to global procedures in 2022. Notably, only two hospitals, Imam Hossein Ahram and Amir Genaveh, experienced a net gain from global procedures.
| Hospital Names | Frequency | Total Actual Costs (Bill Cost) | Total Global Costs | Benefit/Loss | P-Value |
|---|---|---|---|---|---|
| Martyrs of the Persian Gulf | 3,558 | 161, 099, 701, 863 | 143, 088, 468, 451 | -18, 011, 233, 412 | < 0.001 |
| Sahid Sadeq Ganji | 2,373 | 101, 995, 870, 737 | 93, 113, 178, 385 | -8, 882, 692, 352 | < 0.001 |
| Imam Khomeini Kangan | 2,836 | 99, 303, 093, 551 | 96, 192, 766, 729 | -3, 110, 326, 822 | < 0.001 |
| Zeinabiyya Khormoj | 1,193 | 53, 477, 655, 955 | 49, 477, 966, 200 | -3, 999, 689, 755 | < 0.001 |
| Amir al-Mu'minin Genaveh | 1,944 | 67, 982, 813, 227 | 70, 546, 271, 689 | 2, 563, 458, 462 | < 0.001 |
| Baqiyeh al-Azam Daylam | 388 | 14, 176, 243, 268 | 12, 522, 040, 340 | -1, 654, 202, 928 | < 0.001 |
| Imam Hadi Deir | 202 | 8, 882, 434, 333 | 7, 928, 159, 054 | -954, 275, 279 | < 0.001 |
| Imam Hossein Ahram | 33 | 446, 139, 167 | 643, 464, 667 | 197, 325, 500 | < 0.001 |
| Total | 12,527 | 507, 363, 952, 101 | 473, 512, 315, 515 | -33, 851, 636, 586 | 0.046 |
Profit or Loss from Global Procedures in 2022 by Hospitals Affiliated to Bushehr University of Medical Sciences
According to the findings in Table 3, out of 12,527 global procedures, in 5,227 cases, the actual cost was less than the global tariff, and hospitals achieved a total profit of about 228 billion rials. Conversely, in 7,300 cases, the actual cost exceeded the announced global tariff, resulting in total losses for hospitals amounting to 566 billion rials. The findings also indicate that these 15 global procedures represent approximately 90 percent of all medical procedures. Furthermore, the highest hospital losses were associated with cesarean sections, vaginal deliveries, appendicitis, cholecystectomy, hernia repair, curettage, abortions, inguinal hernia repairs, and tonsillectomies, respectively. In terms of frequency, the five procedures for which hospitals experienced the most losses were cesarean section, childbirth, appendicitis, cataracts, and pilonidal cysts, respectively.
| Surgery Names | Frequency of Profitable Surgeries | Frequency of Unprofitable Surgeries | Total Surgeries | Average Length of Stay | Total Bill Cost (Profitable Surgeries) | Total Bill Cost (Unprofitable Surgeries) | Total Bill Cost | Average Bill Cost (Profitable Surgeries) | Average Bill Cost (Unprofitable Surgeries) | Average Total Bill Cost | Total Global Cost (Profitable Surgeries) | Total Global Cost (Unprofitable Surgeries) | Total Global Cost |
|---|---|---|---|---|---|---|---|---|---|---|---|---|---|
| Cesarean section | 1,264 (29.40) | 3,035 (70.60) | 4,299 | 1.61 | 54,817,744,815 | 168,630,488,594 | 223,448,233,409 | 43,368,469 | 55,561,940 | 51,976,793 | 58,609,584,714 | 144,095,189,214 | 202,704,773,928 |
| Delivery | 1,571 (38.52) | 2,507 (61.48) | 4,078 | 1.1 | 38,411,415,503 | 108,352,655,922 | 146,764,071,425 | 24,450,296 | 43,220,046 | 35,989,228 | 42,087,887,048 | 90,671,051,635 | 132,758,938,683 |
| Excision and drainage of appendiceal abscess or peritonitis resulting from IT | 291 (38.70) | 461 (61.30) | 752 | 1.8 | 10,335,612,815 | 22,466,680,238 | 32,802,293,053 | 35,517,570 | 48,734,664 | 43,620,071 | 11,457,664,477 | 18,758,593,572 | 30,216,258,049 |
| Cataract surgery | 385 (80.88) | 91 (19.12) | 476 | 1.01 | 11,221,742,626 | 3,780,082,951 | 15,001,825,577 | 29,147,383 | 41,539,373 | 31,516,440 | 13,433,367,205 | 3,448,427,725 | 16,881,794,930 |
| Excision of a pilonidal cyst or sinus; simple, extensive, or complicated | 234 (81.25) | 54 (18.75) | 288 | 1.13 | 4,381,861,921 | 1,786,089,348 | 6,167,951,269 | 18,725,906 | 33,075,729 | 21,416,497 | 5,829,264,065 | 1,542,632,972 | 7,371,897,037 |
| Dilation and curettage, diagnostic or therapeutic, non-obstetric | 73 (35.96) | 130 (64.04) | 203 | 1.1 | 1,000,046,387 | 2,762,860,084 | 3,762,906,471 | 13,699,266 | 21,252,770 | 18,536,485 | 1,446,938,747 | 2,166,972,898 | 3,613,911,645 |
| Inguinal hernia repair | 95 (62.09) | 58 (37.91) | 153 | 1.28 | 2,203,536,231 | 2,479,689,403 | 4,683,225,634 | 23,195,118 | 42,753,266 | 30,609,318 | 2,760,570,360 | 2,017,696,049 | 4,778,266,409 |
| Primary inguinal hernia repair | 72 (47.37) | 80 (52.63) | 152 | 1.43 | 1,758,701,351 | 3,213,863,674 | 4,972,565,025 | 24,426,408 | 40,173,296 | 32,714,244 | 2,263,012,012 | 2,411,411,112 | 4,674,423,124 |
| Simple or complicated internal and external hemorrhoidectomy, extensive with or without fissures | 107 (86.70) | 16 (13.01) | 123 | 1.18 | 1,850,450,353 | 493,549,722 | 2,344,000,075 | 17,293,929 | 30,846,858 | 19,056,911 | 2,638,196,425 | 429,329,747 | 3,067,526,172 |
| Treatment of incomplete abortion, with surgery or therapy | 46 (38.02) | 75 (61.98) | 121 | 1.36 | 794,289,901 | 1,988,794,073 | 2,783,083,974 | 17,267,172 | 26,517,254 | 23,000,694 | 1,229,629,751 | 1,475,358,905 | 2,704,988,656 |
| Cervical cerclage during pregnancy; vaginally or abdominally | 32 (27.35) | 85 (72.65) | 117 | 1.48 | 487,327,830 | 2,013,760,415 | 2,501,088,245 | 15,228,995 | 23,691,299 | 21,376,823 | 662,664,032 | 1,656,598,935 | 2,319,262,967 |
| Cholecystectomy | 57 (49.14) | 59(50.86) | 116 | 2.4 | 3,217,131,671 | 4,738,107,447 | 7,955,239,118 | 56,440,907 | 80,306,906 | 68,579,648 | 3,745,798,730 | 3,742,874,546 | 7,488,673,276 |
| Varicocele excision with ligation of the spermatic veins | 98 (90.74) | 10 (9.26) | 108 | 1.01 | 1,801,534,454 | 227,117,434 | 2,028,651,888 | 18,383,005 | 22,711,743 | 18,783,814 | 2,271,075,690 | 213,180,992 | 2,484,256,682 |
| Neurolysis or neuroplasty of any nerve in the wrist or arm or leg | 95 (95) | 5 (5) | 100 | 1 | 1,252,010,692 | 132,191,843 | 1,384,202,535 | 13,179,060 | 26,438,369 | 13,842,025 | 1,889,565,309 | 118,825,240 | 2,008,390,549 |
| Tonsillectomy with or without adenoidectomy | 23 (24.47) | 71 (75.53) | 94 | 1.16 | 518,058,463 | 2,376,203,841 | 2,894,262,304 | 22,524,281 | 33,467,660 | 30,790,025 | 571,468,133 | 1,999,214,951 | 2,570,683,084 |
| Other surgeries | 784 (58.20) | 563 (41.80) | 1,347 | 1.85 | 22,005,564,465 | 25,864,787,634 | 47,870,352,099 | 28,068,322 | 45,941,008 | 35,538,495 | 27,979,629,657 | 19,898,640,667 | 47,878,270,324 |
| Total | 5,227 (41.73) | 7,300 (58.27) | 12,527 | 1.43 | 156,057,029,478 | 351,306,922,623 | 507,363,952,101 | 29,855,946 | 40,501,633 | 48,124,236 | 178,876,316,355 | 294,645,999,160 | 473,522,315,515 |
Profit and Loss from the 15 Most Frequent Global Procedures in 2022 in University Hospitals Affiliated with Bushehr University of Medical Sciences
| Surgery Names | Average Global Cost (Profitable Surgeries) | Average Global Cost (Unprofitable Surgeries) | Average Total Global Cost | Difference Between Global Cost and Bill Cost (Profit Surgeries) (%) | Difference Between Global Cost and Bill Cost (Unprofitable Surgeries) (%) | Difference Between Global Cost and Bill Cost (Total) (%) | Profit | Loss | Benefit/ Loss | Average of Profitable Surgeries | Average of Unprofitable Surgeries | Total Average | Proportion of Each Surgery from Total Profit and Loss (%) | P-Value | |
|---|---|---|---|---|---|---|---|---|---|---|---|---|---|---|---|
| 1 | 2 | ||||||||||||||
| Cesarean Section | 46,368,342 | 47,477,822 | 47,151,611 | 6.47 | -17.03 | -10.23 | 3,791,839,899 | -24,535,299,380 | -20,743,459,481 | 2,999,873 | -8,084,118 | -5,084,245 | 16.62 | -43.30 | < 0.0001 |
| Delivery | 26,790,507 | 36,167,153 | 32,554,914 | 8.74 | -19.50 | -10.55 | 3,676,471,545 | -17,681,604,287 | -14,005,132,742 | 2,340,211 | -7,052,894 | -3,434,314 | 16.11 | -31.21 | < 0.0001 |
| Excision and Drainage of Appendiceal Abscess or Peritonitis Resulting from It | 39,373,417 | 40,691,092 | 40,181,194 | 9.79 | -19.77 | -8.56 | 1,122,051,662 | -3,708,086,666 | 4,830,138,328 | 3,855,848 | -8,043,572 | 6,423,056 | 4.92 | -6.54 | < 0.0001 |
| Cataract Surgery | 34,891,863 | 37,894,810 | 35,465,956 | 16.46 | -9.62 | 11.14 | 2,211,624,581 | -331,655,226 | 2,543,279,807 | 5,744,479 | -3,644,563 | 5,343,025 | 9.69 | -0.59 | < 0.0001 |
| Excision of a Pilonidal Cyst or Sinus; Simple, Extensive, or Complicated | 24,911,385 | 28,567,277 | 25,596,865 | 24.83 | -15.78 | 16.33 | 1,447,402,144 | -243,456,376 | 1,203,945,768 | 6,185,479 | -4,508,451 | 4,180,367 | 6.34 | -0.43 | < 0.0001 |
| Dilation and Curettage, Diagnostic or Therapeutic, Non-Obstetric | 19,821,079 | 16,669,022 | 17,802,520 | 30.89 | -27.50 | -4.12 | 446,892,360 | -595,887,186 | -148,994,826 | 6,121,813 | -4,583,748 | -733,965 | 1.96 | -1.05 | 0.19 |
| Inguinal Hernia Repair | 29,058,635 | 34,787,863 | 31,230,499 | 20.18 | -22.90 | 1.99 | 557,034,129 | -461,993,354 | 95,040,775 | 5,863,517 | -7,965,403 | 621,182 | 2.44 | -0.82 | 0.433 |
| Primary Inguinal Hernia Repair | 31,430,722 | 30,142,639 | 30,752,784 | 22.28 | -33.28 | -6.38 | 504,310,661 | -802,452,562 | -298,141,901 | 7,004,315 | -10,030,657 | -1,961,460 | 2.21 | -1.42 | 0.125 |
| Simple or Complicated Internal and External Hemorrhoidectomy, Extensive with or without Fissures | 24,656,041 | 26,833,109 | 24,939,237 | 29.86 | -14.96 | 23.59 | 787,746,072 | -64,219,975 | 723,526,097 | 7,362,113 | -4,013,748 | 5,882,326 | 3.45 | -0.11 | 0.000 |
| Treatment of Incomplete Abortion, with Surgery or Therapy | 26,731,082 | 19,671,452 | 22,355,278 | 35.40 | -34.80 | -2.89 | 435,339,850 | -513,435,168 | -78,095,318 | 9,463,910 | -6,845,802 | -645,416 | 1.91 | -0.91 | 0.559 |
| Cervical Cerclage During Pregnancy; Vaginally or Abdominally | 20,708,251 | 19,489,399 | 19,822,760 | 26.46 | -21.56 | -7.84 | 175,336,202 | -357,161,480 | -181,825,278 | 5,479,256 | -4,201,900 | -1,554,062 | 0.77 | -0.63 | 0.007 |
| Cholecystectomy | 65,715,767 | 63,438,552 | 64,557,528 | 14.11 | -26.59 | -6.23 | 528,667,059 | -995,232,901 | -466,565,842 | 9,274,861 | -16,868,354 | -4,022,119 | 2.32 | -1.76 | 0.015 |
| Varicocele Excision with Ligation of the Spermatic Veins | 23,174,242 | 21,318,099 | 23,002,377 | 20.67 | -6.54 | 18.34 | 469,541,236 | -13,936,442 | 455,604,794 | 4,791,237 | -1,393,644 | 4,218,563 | 2.06 | -0.02 | 0.000 |
| Neurolysis or Neuroplasty of any Nerve in the Wrist or Arm or Leg | 19,890,161 | 23,765,048 | 20,083,905 | 33.74 | -11.25 | 31.08 | 637,554,617 | -13,366,603 | 624,188,014 | 6,711,101 | -2,673,321 | 6,241,880 | 2.79 | -0.02 | 0.000 |
| Tonsillectomy with or without Adenoidectomy | 24,846,441 | 28,157,957 | 27,347,692 | 9.35 | -18.86 | -12.59 | 53,409,670 | -376,988,890 | -323,579,220 | 2,322,160 | -5,309,703 | -3,442,332 | 0.23 | -0.67 | 0.000 |
| Other Surgeries | 35,688,303 | 35,343,944 | 35,544,373 | 21.35 | -29.98 | 0.02 | 5,974,065,190 | -5,966,146,967 | 7,918,223 | 7,619,981 | -10,597,064 | 5,878 | 26.18 | -10.53 | - |
| Total | 34,221,603 | 40,362,466 | 37,800,137 | 12.76 | -19.23 | -7.15 | 22,819,286,877 | -56,660,923,463 | -33,841,636,586 | 4,365,657 | -7,761,770 | -2,701,496 | 100.00 | -100.00 | 0.046 |
Profit and Loss from the 15 Most Frequent Global Procedures in 2022 in University Hospitals Affiliated with Bushehr University of Medical Sciences
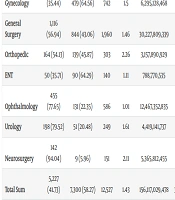
As illustrated in Table 4, a total of 9,138 cases, constituting 73% of the cases subject to the global tariff, were associated with the Department of Gynecological Surgery. The proportion of natural birth/cesarean section and other surgical procedures in this department was 92% and 8%, respectively.
| Department Names | Frequency of Profitable Surgeries; No. (%) | Frequency of Unprofitable Surgeries; No. (%) | Total | Average Length of Stay | Total Bill Cost (Profitable Surgeries) | Total Bill Cost (Unprofitable Surgeries) | Total Bill Cost | Average Billing Cost (Profitable Surgeries) | Average Billing Cost (Unprofitable Surgeries) | Average of Total Bill Cost | Total Global Cost (Profitable Surgeries) | Total Global Cost (Unprofitable Surgeries) | Total Global Cost |
|---|---|---|---|---|---|---|---|---|---|---|---|---|---|
| Obstetrics and gynecology | 2,839 (33.81) | 5,557 (66.19) | 8,396 (67) | 1.37 | 93,395,123,180 | 277,760,644,238 | 371,155,767,418 | 32,897,190 | 49,983,920 | 44,206,261 | 100,817,156,220 | 235,371,079,359 | 336,188,235,579 |
| Women surgery (other than obstetrics and gynecology | 263 (35.44) | 479 (64.56) | 742 | 1.5 | 6,295,128,468 | 14,381,211,337 | 20,676,339,805 | 23,935,850 | 30,023,406 | 27,865,687 | 7,997,602,787 | 11,443,836,309 | 19,441,439,096 |
| General surgery | 1,116 (56.94) | 844 (43.06) | 1,960 | 1.46 | 30,227,809,339 | 40,858,715,590 | 71,086,524,929 | 27,085,851 | 48,410,800 | 36,268,635 | 37,229,831,279 | 33,104,912,688 | 70,334,743,967 |
| Orthopedic | 164 (54.13) | 139 (45.87) | 303 | 2.26 | 3,157,890,929 | 7,492,864,938 | 10,650,755,867 | 19,255,432 | 53,905,503 | 35,151,009 | 4,069,081,319 | 5,447,623,074 | 9,516,704,393 |
| ENT | 50 (35.71) | 90 (64.29) | 140 | 1.11 | 788,770,535 | 2,844,025,553 | 3,632,796,088 | 15,775,411 | 31,600,284 | 25,948,543 | 931,203,333 | 2,340,261,754 | 3,271,465,087 |
| Ophthalmology | 455 (77.65) | 131 (22.35) | 586 | 1.01 | 12,467,352,835 | 4,772,517,097 | 17,239,869,932 | 27,400,775 | 36,431,428 | 29,419,573 | 14,970,104,965 | 4,255,804,322 | 19,225,909,287 |
| Urology | 198 (79.52) | 51 (20.48) | 249 | 1.61 | 4,419,141,737 | 2,408,228,373 | 6,827,370,110 | 22,318,898 | 47,220,164 | 27,419,157 | 5,704,719,349 | 1,978,179,984 | 7,682,899,333 |
| Neurosurgery | 142 (94.04) | 9 (5.96) | 151 | 2.11 | 5,365,812,455 | 788,715,497 | 6,154,527,952 | 37,787,412 | 87,635,055 | 40,758,463 | 7,156,617,103 | 704,301,670 | 7,860,918,773 |
| Total sum | 5,227 (41.73) | 7,300 (58.27) | 12,527 | 1.43 | 156,117,029,478 | 351,306,922,623 | 507,423,952,101 | 29,867,425 | 48,124,236 | 40,506,422 | 178,876,316,355 | 294,645,999,160 | 473,522,315,515 |
The Distribution of Profits and Losses from Global Procedures Based on the Service Provider Department in 2022 in University Hospitals Affiliated with Bushehr University of Medical Sciences
| Department Names | Average Global Cost (Profitable Surgeries) | Average Global Cost (Unprofitable Surgeries) | Average Total Global Cost | Difference Between Global Cost and Billing Cost (Profit Surgeries) (%) | Difference Between Global Cost and Billing Cost (Unprofitable Surgeries) (%) | Difference Between Global Cost and Billing Cost (Total) (%) | Profit | Loss | Benefit/Loss | Average of Profitable Surgeries | Average of Unprofitable Surgeries | Total Average | Proportion of Each Surgery from Total Profit and Loss (%) | P-Value | |
|---|---|---|---|---|---|---|---|---|---|---|---|---|---|---|---|
| 1 | 2 | ||||||||||||||
| Obstetrics and gynecology | 35,511,503 | 42,355,782 | 40,041,476 | 7.95 | -15.26 | -9.42 | 7,482,033,040 | -42,389,564,879 | -34,907,531,839 | 2,635,447 | -7,628,138 | -4,157,638 | 32.79 | -74.81 | < 0.000 |
| Women Surgery (other than obstetrics and gynecology | 30,409,136 | 23,891,099 | 26,201,400 | 27.04 | -20.43 | -5.97 | 1,702,474,319 | -2,937,375,028 | -1,234,900,709 | 6,473,286 | -6,132,307 | -1,664,287 | 7.46 | -5.18 | < 0.000 |
| General surgery | 33,360,064 | 39,223,830 | 35,885,073 | 23.16 | -18.98 | -1.06 | 7,002,021,940 | -7,753,802,902 | -751,780,962- | 6,274,213 | -9,186,970 | -383,562 | 30.68 | -13.68 | 0.161 |
| Orthopedic | 24,811,471 | 39,191,533 | 31,408,265 | 28.85 | -27.30 | -10.65 | 911,190,390 | -2,045,241,864 | 1,134,051,474- | 5,556,039 | -14,713,970 | 3,742,744- | 3.99 | -3.61 | < 0.000 |
| ENT | 18,624,067 | 26,002,908 | 23,367,608 | 18.06 | -17.71 | -9.95 | 142,432,798 | -503,763,799 | -361,331,001 | 2,848,656 | -5,597,376 | -2,580,936 | 0.62 | -0.89 | < 0.000 |
| Ophthalmology | 32,901,330 | 32,487,056 | 32,808,719 | 20.07 | -10.83 | 11.52 | 2,502,752,130 | -516,712,775- | 1,986,039,355 | 5,500,554 | -3,944,372 | 3,389,146 | 10.97 | 0.91 | < 0.000 |
| Urology | 28,811,714 | 38,787,843 | 30,855,017 | 29.09 | -17.86 | 12.53 | 1,285,577,612 | -430,048,389 | 855,529,223 | 6,492,816 | -8,432,321 | 3,435,860 | 5.63 | -0.76 | < 0.000 |
| Neurosurgery | 50,398,712 | 78,255,741 | 52,059,065 | 33.37 | -10.70 | 27.73 | 1,790,804,648 | -84,413,827 | 1,706,390,821 | 12,611,300 | -9,379,314 | 11,300,601 | 7.85 | -0.15 | < 0.000 |
| Total sum | 34,221,603 | 40,362,466 | 37,800,137 | 14.58 | -16.13 | -6.68 | 22,819,286,877 | -56,660,923,463 | -33,841,636,586 | 4,365,657 | -7,761,770 | -2,701,496 | 100 | 100 | < 0.000 |
The Distribution of Profits and Losses from Global Procedures Based on the Service Provider Department in 2022 in University Hospitals Affiliated with Bushehr University of Medical Sciences
In addition, about 66 percent of the cases in this department have resulted in losses for the hospitals. The profit and loss from these procedures have been equal to 9,184,507,359 and 45,326,939,907 rials, respectively. Consequently, the university hospitals in the province have incurred total losses of 36,142,432,548 rials from performing global procedures in this department. On average, hospitals in the province have lost 3,955,179 rials for each case in this department. In this context, the difference between the billing cost (FFS method) for childbirth/cesarean section procedures and other related gynecological procedures was 9.42% and 5.97%, respectively. The data also shows that this group of procedures accounted for 80 percent of total loss cases.
According to the findings presented in Table 4, the Department of General Surgery ranks second with a total of 1,960 operations, which constitutes 16% of all global procedures. Within this department, 43% of cases resulted in losses, amounting to 7,753,802,902 rials. Conversely, 57% of cases led to a profit of 7,002,021,940 rials. The average loss per patient in this department was 383,562 rials, and this department accounted for 13.68% of the total losses experienced by the hospitals.
In addition, the findings show that the ophthalmology department ranked third with 586 procedures, equivalent to 4.68% of the total global procedures. In this group, 22% of the cases were subject to losses, with the total loss of this department amounting to 516,712,775 rials and its profit being 2,502,752,130 rials. The findings indicate that, on average, university hospitals realized a profit of 3,389,146 rials per case in this department. The findings further suggest that the orthopedic, urology, neurology, and ENT departments account for 6% of the total global procedures, with 303, 249, 151, and 140 cases, respectively. Of the four aforementioned departments, urology and neurology demonstrated profitability, whereas orthopedic and ENT incurred losses.
5. Discussion
The present study simultaneously examined and compared two reimbursement methods, the global and the FFS method, for cases subject to global tariffs. The results indicated that global tariffs covered 93% of the costs recorded in the patient’s bill. In other words, the global reimbursement method led to the non-reimbursement of approximately 7% of costs to hospitals, resulting in a total loss of 33,851,636,586 rials for 12,527 cases subject to the global tariff in 2022.
From another perspective, the results indicated that, of the total cases subject to the global tariff in all the hospitals studied, 5,227 cases (equivalent to 41.7 percent of the total cases) resulted in a profit for the hospitals. In the remaining 7,300 cases, however, the hospitals incurred a loss, resulting in an average loss of 2,701,495 rials per case.
The comparison of the two reimbursement methods, global and FFS, has also been examined in other studies. In this regard, the study by Zarei et al. on Qazvin hospitals in 2024 indicated that global tariffs covered 78 percent of the costs calculated using the FFS method, leading to financial losses for the hospitals (17). The findings of a study conducted by Dorrani et al. in Brigand further demonstrated that, in 52 percent of cases subject to the global tariff, the amount of reimbursement under the global method was lower than the amount calculated under the FFS method (18).
The findings of Behzadi et al.'s study demonstrated that the average reimbursement for cases subject to the global tariff was less than the costs of such cases under the FFS method (19). In this line, the results of the study by Zare Askari et al. in Rafsanjan and Rezaee et al. in Tehran revealed that, in all global surgeries examined, the global tariff was lower than the billed costs, indicating that the hospital incurred a financial loss (20, 21). The findings of the study by Chatruz et al., which was conducted on 9 hospitals in Tehran province, also found that overall, hospitals have suffered losses due to the implementation of global tariffs (15). Conversely, a study by Hosseini-Eshpala et al. found that a hospital in Hormozgan made a profit in 86% of the 1,286 cases examined (16).
The findings of the present study also emphasize that in procedures such as cesarean section, vaginal delivery, abscess, curettage, uterine cerclage, and tonsillectomy, the frequency of unprofitable procedures was higher than beneficial procedures, and hospitals overall suffered losses. However, in procedures such as varicocele, hemorrhoids, neuroplastic, inguinal hernia, pilonidal cyst, and cataract, the frequency of beneficial procedures was higher than unprofitable procedures, and the global reimbursement method was in favor of hospitals. These findings contradict the conclusions of the study by Behzadi et al., which reported that 100% of the procedures were unprofitable (19). Yet, it is somewhat consistent with the study of Chatruz et al., which found that global procedures were unprofitable in 61 cases and profitable in 6 cases (15). The study of Rezaee et al. also showed that the hospitals studied suffered losses due to cesarean section and delivery cases, which is consistent with the results of the present study (21). The lower global tariffs for procedures such as cesarean section, uterine cerclage, and delivery were also confirmed in the study of Zare Askari et al. (20). The findings of the study by Hosseini-Eshpela et al. demonstrated that the hospital under investigation realized a profit from cesarean sections and deliveries. This outcome is not consistent with the results of the present study. However, when viewed in the context of incurring loss in curettage, it is consistent with the current study (16).
Comparing the global reimbursement method and FFS by department also showed that, in general, applying global tariffs in the ophthalmology, urology, and neurology departments has led to financial gains for hospitals. Conversely, the orthopedics, gynecology, ENT, and general surgery departments have resulted in financial losses for hospitals. Imposing losses on hospitals in the departments of gynecology and obstetrics, general surgery, orthopedics, and ENT has also been reported in other studies (20-22). Some studies have also demonstrated that the implementation of global tariffs in the departments of gynecology and obstetrics, general surgery, and ophthalmology has resulted in profits for hospitals (16).
Comparing the standard and actual hospitalization days also showed that the actual hospitalization days are significantly less than the standard hospitalization days. In addition, the average actual hospitalization in the unprofitable global procedures was found to be significantly longer than the profitable ones (P < 0.001). This finding is consistent with the results of the studies by Rezaee and Hosseini-Eshpela (16, 21). Studies of prospective payment systems in other countries have shown mixed results. A study in Greece of two hospitals found that DRG-based payment in intensive care and oncology did not cover all of the costs incurred through FFS, contributing to poor quality and hospital budget deficits (23). A further investigation, undertaken in Italy and focusing on thyroidectomy cases, revealed that the hospital incurred financial losses following the adoption of the DRG payment system (24). Another study conducted in a French public hospital demonstrated that the reimbursement rate for prostate surgery using the DRG method was lower than its actual cost, especially in cases of complications that resulted in prolonged hospital stays (25).
The findings of the present study and other studies indicate that the implementation of global tariffs, depending on the type of hospital, type of procedure, and department, can have different effects on hospitals. The modification of the payment method from retrospective to prospective, taking into account variables such as the severity of the disease (17, 26), complexity of the procedure (17, 27), presence of comorbidities, age and gender of the patient, and also the level of inflation in society (14, 17), has the potential to result in a sense of satisfaction for the provider, insurer, and patient.
It is imperative to note that cost control mechanisms, particularly early discharge, should not result in a diminution of service quality. The primary objective of prospective tariffs is to curtail health system expenditures by avoiding resource wastage and ineffective measures, rather than by diminishing the provision of essential services to patients (17). In addition, hospital managers and medical staff should be aware that, based on prospective payment systems, any failure in service provision, such as medical errors or postoperative infections that can lead to prolonged patient hospitalization, will result in losses to the hospitals, and no excess costs will be paid by insurance companies.
Since this study was conducted in one province and with a limited number of hospitals, the results of this study cannot be generalized to the entire country, and caution should be exercised in presenting the results. Subsequent studies could investigate the influence of variables associated with the physician, hospital, and patient on the profit/loss of hospitals. These variables may include physician collaboration status (full-time or part-time), physician experience, patient and physician gender, the presence of comorbidities, patient age, and degree of accreditation or training/therapeutic status.
To sum up, the present study can provide significant evidence for policymakers that if approved tariffs are not adjusted to real costs and in line with inflation, hospitals may face budget deficits, which in turn may lead hospitals to take actions that conflict with the goals of the health system. Disproportionate tariffs have the potential to result in a number of adverse consequences for patients, including being compelled to provide a portion of the necessary surgical supplies themselves, which can lead to elevated out-of-pocket expenses. In certain instances, an early discharge of the patient may be employed as an operational strategy by hospitals. Furthermore, in certain instances, due to the complexity of the condition and the presence of comorbidities, medical practitioners may elect to decline the admission of high-risk patients.
5.1. Conclusions
The findings indicate that although 93% of actual costs are covered by the global payment method, the impact of global tariffs varies depending on the type of procedure. In certain departments, the aggregate outcome is favorable, with hospitals realizing financial gains from global procedures. Conversely, in departments such as gynecological surgery, global tariffs often do not cover the costs, and hospitals incur losses. Consequently, it is imperative to adjust global tariffs by taking into account factors such as the patient's age, gender, the severity of the disease, and the presence of other illnesses. In the event of a price fluctuation in drugs and consumable equipment, the tariffs must be adjusted to maintain parity with inflation.
