


1. Background
Nurses constitute the largest group of healthcare providers, are at the frontline of healthcare provision, and deliver around 80% of all direct healthcare services (1).
Working in clinical settings imposes significant strain and stress on nurses. The American Society of Safety Professionals has categorized nursing at the top of the forty most stressful professions (2).
Workplace problems can negatively affect nurses’ general health (GH) (3). Goldberg and Hillier defined GH as physical and mental health, consisting of the absence of a set of symptoms, namely somatic symptoms, anxiety and insomnia, social dysfunction, and depression (4). A review study reported that nurses’ GH was at a moderate level, with 62% of them having poor or at-risk health status, and highlighted that the most significant health problems among nurses were mental disorders. According to that study, nurses’ health was significantly related to work-related factors, family life, and religious beliefs (5). Another study showed that 77.8% of nurses were exposed to workplace stressors and emphasized that these stressors can negatively affect their GH, leading to side effects such as headaches, exhaustion, irritability, and difficulty concentrating (6).
Workplace problems and reduced GH may, in turn, lower nurses’ quality of work life (QWL) (7). The QWL can be defined both objectively and subjectively. Objective QWL refers to a set of actual conditions in an organization, including salaries, welfare facilities, and hygiene, and safety, participation in decision-making, democracy, supervision, work diversity, and work enrichment. Subjective QWL refers to individuals’ perceptions of their quality of life at work (8).
Some studies have reported positive effects of QWL, including improvements in job satisfaction and productivity, as well as reductions in employee burnout and absenteeism (9, 10). However, some studies have shown conflicting results, such as a study conducted in Iran which found no relationship between QWL and critical thinking among nurses (11).
One of the emerging concepts in improving the workplace is cultivating a spiritual workplace. Workplace spirituality (WS) is an inspiring force and a motive behind the continuous search for meaning in life and work, as well as understanding the value of work. It involves efforts to search for and find the ultimate goal in professional life and to establish meaningful relationships among colleagues (12). The WS operates at three levels: The personal level (performing meaningful work), the group level (sense of alignment), and the organizational level (community among shared values) (13).
A study conducted in Korea showed that a spiritual workplace can accelerate the readjustment of nursing staff who have survived cancer when returning to work (14). Another study in Malaysia demonstrated a positive and significant relationship between dimensions of WS and nurses' job performance (15). Additionally, other studies reported that WS had a significant relationship with employees’ adherence to professional ethics, provision of spiritual care, and reduction of job burnout and deviant behaviors among nurses (16-18).
Although several studies have highlighted the beneficial impacts of WS (13, 14, 17), to the best of our knowledge, no research has directly explored the relationship between WS and the GH and QWL of nurses. Moreover, since the concept of a spiritual workplace is dynamic and shaped by social, cultural, and religious contexts, findings from research conducted in other countries cannot be generalized to the Iranian nursing community. Therefore, the researchers decided to conduct a study aimed at determining the relationship between WS, GH, and QWL in nurses.
2. Objectives
This study aims to examine the relationship between WS, GH, and QWL in nurses.
3. Methods
3.1. Research Design and Participants
This cross-sectional analytical study was conducted in 2023. The study population included all nurses working in three hospitals affiliated with Khoy University of Medical Sciences during the sampling period (from April to June 2023).
Inclusion criteria were agreement to participate, a bachelor’s degree or higher in nursing, at least one year of clinical work experience, and no significant life event during the past six months (such as major losses or acute health problems). Participants who chose not to continue their participation at any stage of the research or who completed the questionnaires incompletely were excluded from the study.
3.2. Sample Size and Sampling Method
The sample size was calculated based on a previous study (19), using a GH-QWL correlation coefficient of 0.20, a confidence level of 0.95, and a power of 0.80.
The sample size calculation yielded a total of 259 participants. To ensure proportional representation of nurses from each hospital, proportional stratified random sampling was utilized. First, the total number of nurses in each hospital was determined. Then, based on the proportion of nurses in each hospital relative to the total nursing population, the number of samples from each hospital was selected proportionally. Hospital A accounted for 45% of the total nursing population, hospital B for 35%, and hospital C for 20%; accordingly, 45% of the sample (117 nurses) was selected from hospital A, 35% (91 nurses) from hospital B, and 20% (51 nurses) from hospital C.
From the list of nurses at each hospital, participants were selected randomly using a random number table. The researcher visited each hospital and selected the eligible nurses who met the inclusion criteria through simple random selection, ensuring that the selection process was consistent and unbiased across all hospitals.
3.3. Data Collection Instruments
Data were gathered using a demographic questionnaire (including items on age, gender, marital status, number of children, employment status, work experience, weekly work hours, and affiliated ward), the WS Scale, the GH Questionnaire, and the Nurses’ QWL Questionnaire. Participants completed these instruments through the self-report method.
The WS Scale was developed by Milliman et al. in 2003 and consists of twenty items across three dimensions: Meaningful work (items 1 - 6), sense of community (items 7 - 13), and alignment with organizational values (items 14 - 20) (20). The Persian version of this questionnaire was validated by Alizadeh in 2018. Items are scored on a five-point Likert scale from 0 (“Completely disagree”) to 4 (“Completely agree”). The minimum and maximum possible scores are 0 and 80, respectively (16). Based on a review of similar studies, the total score in this questionnaire is not categorized into levels; instead, a higher average score indicates a greater degree of WS (12, 21).
Various studies in Iran have assessed and confirmed the acceptable validity and reliability of the Persian version of this scale (22). According to Milliman et al., the reliability of the instrument for each dimension ranges from 0.88 to 0.94, as measured by Cronbach’s alpha (20). Additionally, a study conducted in Iran reported a Cronbach’s alpha of 0.882 for the total questionnaire (21). In the present study, the reliability of the questionnaire, based on Cronbach's alpha, was calculated for each subscale: Meaningful work (α = 0.894), sense of community (α = 0.861), and alignment with organizational values (α = 0.90).
The GH Questionnaire, developed by Goldberg and Hillier, consists of 28 items divided into four dimensions: Somatic symptoms (items 1 - 7), anxiety and insomnia (items 8 - 14), social dysfunction (items 15 - 21), and severe depression (items 22 - 28). Items are scored from 0 (good health) to 3 (existence of a problem), with a total possible score ranging from 0 to 84 (4). The cut-off point for GH is 23, and for each dimension, it is six. Thus, a score of 23 or below in GH and six or below in any dimension indicates healthy individuals without symptoms of health disorders, whereas a score of 24 or above in GH and seven or above in any dimension indicates individuals with symptoms of health disorders.
Taghavi assessed and confirmed the content, concurrent, and construct validity of the questionnaire, reporting a test-retest correlation coefficient, a split-half reliability coefficient, and a Cronbach’s alpha of 0.93, 0.7, and 0.9, respectively (23). In the present study, the reliability of the instrument was obtained using Cronbach's alpha coefficient and found to be 0.90.
The QWL of nurses was assessed using the Persian version of the Quality of Nursing Work Life (QNWL) Scale, originally developed by Brooks and Anderson. This scale consists of 42 items scored on a six-point scale ranging from “Very much” to “Very low,” with a total possible score ranging from 42 (lowest QWL) to 252 (highest QWL). Scores between 42 - 94.5, 94.5 - 147, 147 - 199.5, and 199.5 - 252 indicate weak, moderate, good, and very good QWL, respectively.
The validity of the Persian version of the Brooks and Anderson’s QNWL Scale was assessed by Navidian et al. in 2012 (24). Content validity was confirmed through review and approval by 20 faculty members. The reliability of the tool, assessed by Kiani et al., was reported at 0.93 (25). In the present study, to evaluate internal reliability, the questionnaire was distributed to 20 nurses who were not part of the main research sample, and the Cronbach’s alpha was found to be 0.87.
3.4. Ethical Considerations
This study obtained approval from the Ethics Committee of Khoy University of Medical Sciences, Khoy, Iran (code: IR.KHOY.REC.1401.001). Nurses who agreed to participate were provided with explanations about the study’s aim, the voluntary nature of participation, and data confidentiality. Written informed consent was obtained from all participants.
3.5. Data Analysis
The SPSS software (version 16.0) was used for data analysis. Before data analysis, the normal distribution of quantitative data was confirmed using the Kolmogorov-Smirnov test. In the descriptive statistics section, frequency, percentage, mean, and standard deviation were used. The relationships between WS and GH and QWL were examined using Pearson’s correlation analysis and linear regression analysis. Additionally, the relationships between demographic characteristics and GH and QWL were examined using the independent-sample t-test and one-way analysis of variance (ANOVA). The level of significance in all analyses was set at less than 0.05.
4. Results
Participants were 259 hospital nurses with a mean age of 33.44 ± 7.69 years, a mean work experience of 9.38 ± 7.18 years, and a mean monthly work hour of 160.3 ± 17.59 hours. Most participants were aged 24 - 34 years (61%), were female (69.5%), were married (76.4%), worked in just one setting (96.5%), worked exclusively in nursing (97.3%), and held formal employment (54.4%). Additionally, more than one-third of participants had between 1 - 5 years of work experience (37.5%). None of the participants reported any history of job turnover or absence from work. Table 1 provides detailed information about participants’ characteristics.
| Characteristics | No. (%) | WS | P-Value | GH | P-Value | QWL | P-Value |
|---|---|---|---|---|---|---|---|
| Age (y) | 0.055 | 0.283 | 0.16 | ||||
| 24 - 34 | 158 (61.0) | 61.72 | 41.66 | 127.24 | |||
| 34 - 44 | 73 (28.2) | 63.24 | 63.24 | 132.24 | |||
| 45 - 54 | 26 (10.0) | 66.5 | 41.23 | 136.07 | |||
| ≥ 55 | 2 (0.8) | 73.5 | 18.0 | 150.0 | |||
| Work experience (y) | 0.16 | 0.159 | 0.088 | ||||
| 5 - 10 | 97 (37.5) | 60.47 | 40.88 | 124.7 | |||
| 6 - 10 | 64 (24.7) | 64.89 | 43.14 | 131.07 | |||
| 11 - 15 | 45 (17.4) | 91.95 | 45.42 | 133.04 | |||
| > 15 | 53 (20.5) | 64.88 | 39.9 | 129.71 | |||
| Work hours (mo) | 0.62 | 0.65 | 0.88 | ||||
| ≤ 144 | 31 (12) | 61.96 | 41.0 | 129.06 | |||
| > 144 | 228 (88) | 82.82 | 42.17 | 129.8 | |||
| Gender | 0.68 | 0.002 | 0.51 | ||||
| Male | 79 (30.5) | 62.48 | 43.76 | 129.03 | |||
| Female | 180 (69.5) | 63.26 | 38.07 | 131.17 | |||
| Marital status | 0.25 | 0.69 | 0.012 | ||||
| Single | 57 (22.0) | 60.03 | 41.61 | 122.5 | |||
| Married | 198 (76.4) | 63.54 | 42.03 | 131.51 | |||
| Other | 4 (1.6) | 60.25 | 47.75 | 150.0 | |||
| Number of children | 0.022 | 0.74 | 0.02 | ||||
| 0 | 113 (43.6) | 60.17 | 41.01 | 124.9 | |||
| 1 | 57 (22.0) | 63.0 | 42.28 | 130.19 | |||
| 2 | 73 (28.2) | 64.8 | 43.19 | 134.28 | |||
| 3 | 16 (6.2) | 70.18 | 43.0 | 141.18 | |||
| Employment type | 0.01 | 0.376 | 0.001 | ||||
| Mandatory service | 37 (14.3) | 63.02 | 39.37 | 129.02 | |||
| Contractual | 18 (7.0) | 69.82 | 43.7 | 136.17 | |||
| Conditional formal | 63 (24.3) | 57.87 | 42.4 | 119.77 | |||
| Permanent formal | 141 (54.4) | 63.68 | 42.49 | 133.01 | |||
| Affiliated ward | 0.95 | 0.011 | 0.552 | ||||
| Surgical care | 29 (11.2) | 63.55 | 40.17 | 138.96 | |||
| Psychiatric care | 14 (5.4) | 60.64 | 32.57 | 124.64 | |||
| Internal medicine | 55 (21.2) | 63.96 | 40.09 | 129.2 | |||
| Neonatal and pediatric care | 46 (17.8) | 63.04 | 42.97 | 126.89 | |||
| Critical care | 52 (20.1) | 61.78 | 45.11 | 131.09 | |||
| Ear, nose, and throat | 10 (3.9) | 65.5 | 39.8 | 133.6 | |||
| Emergency | 12 (4.6) | 62.25 | 35.16 | 124.16 | |||
| Neurological care | 25 (9.7) | 63.2 | 47.32 | 130.24 | |||
| Infectious diseases | 16 (6.2) | 58.75 | 45.87 | 123.75 |
Participants’ Sociodemographic Characteristics
The mean scores of participants’ QWL, WS, and GH were 129.7 ± 25.30 (possible range: 45 - 225), 62.72 ± 14.30 (possible range: 0 - 80), and 42.03 ± 13.65 (possible range: 0 - 84), respectively. According to the scoring of the measurement tools, nurses exhibited moderate QWL and symptoms indicative of GH disorders. The average score obtained from the WS Scale was 62 out of 80, indicating that nurses considered their work environment to be relatively spiritual.
Table 2 presents the mean scores of the different dimensions of QWL, WS, and GH. Among the GH dimensions, the highest mean score was observed in social dysfunction, while the lowest mean score was observed in the depression dimension.
| Outcomes | Mean ± SD | Possible Range |
|---|---|---|
| WS | ||
| Meaningful work | 19.75 ± 5.06 | 0 - 24 |
| Sense of community | 23.35 ± 5.39 | 0 - 28 |
| Alignment with organizational values | 19.61 ± 5.57 | 0 - 28 |
| Total | 62.72 ± 14.30 | 0 - 80 |
| GH | ||
| Somatic symptoms | 11.64 ± 4.57 | 0 - 21 |
| Anxiety and insomnia | 11.94 ± 5.71 | 0 - 21 |
| Social dysfunction | 12.40 ± 4.1 | 0 - 21 |
| Severe depression | 6.03 ± 5.43 | 0 - 21 |
| Total | 42.03 ± 13.65 | 0 - 84 |
| QWL | 129.7 ± 25.3 | 45 - 225 |
The Mean Scores of Workplace Spirituality, General Health, Quality of Work Life, and Their Dimensions
The results of the independent-sample t-test and the one-way ANOVA showed that the total mean score of WS had a significant relationship with the number of children and employment status (P < 0.05). The mean score of GH also had a significant relationship with gender and affiliated ward (P < 0.05), and the mean score of QWL had a significant relationship with marital status, number of children, and employment status (P < 0.05) (Table 1).
Moreover, significant relationships were observed between: The mean score of the somatic symptoms dimension of GH and age, gender, and affiliated ward; the mean score of the anxiety and insomnia dimension and gender; the mean score of social dysfunction and both age and affiliated ward; the mean score of the depression dimension and both age and work experience (P < 0.05).
The results of Pearson’s correlation analysis showed a significant positive correlation between WS and QWL, and significant negative correlations between WS and the social dysfunction, anxiety and insomnia, and depression dimensions of GH (P < 0.05). The QWL also had significant positive correlations with all three dimensions of WS (P < 0.05).
The somatic symptoms dimension of GH had no significant correlation with the three dimensions of WS (P > 0.05). However, the three dimensions of WS had significant negative correlations with the social dysfunction and the anxiety and insomnia dimensions of GH (P < 0.05). Additionally, the meaningful work dimension of WS showed a significant positive correlation with the depression dimension of GH (P < 0.05) (Table 3).
| Outcomes | Meaningful Work (r) | Sense of Community (r) | Alignment with Organizational Values (r) | Total WS (r) |
|---|---|---|---|---|
| GH | ||||
| Somatic symptoms | -0.11 | -0.098 | -0.104 | -0.117 |
| Anxiety and insomnia | -0.225 a | -0.23 a | -0.218 a | -0.253 a |
| Social dysfunction | -0.27 a | -0.314 a | -0.269 a | -0.3 a |
| Severe depression | -0.216 a | -0.086 | -0.034 | -0.123 a |
| QWL | 0.61 a | 0.69 b | 0.65 a | 0.734 a |
The Correlation of Workplace Spirituality with General Health and Quality of Work Life
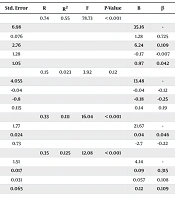
Linear regression analysis was used to predict QWL and GH based on WS and demographic characteristics. The results showed that WS, marital status, number of children, and employment status significantly predicted 54% of the total variance in QWL (P < 0.001).
Moreover, WS and gender significantly predicted 11% of the total variance in the anxiety and insomnia dimension of GH (P < 0.001), and WS, age, and affiliated ward significantly predicted 12.5% of the total variance in the social dysfunction dimension of GH (P < 0.001) (Table 4).
However, WS did not significantly predict the variance in the depression dimension of GH (P > 0.05).
| Dependent Variables and Independent Variables | Std. Error | R | R2 | F | P-Value | B | β | t | P-Value |
|---|---|---|---|---|---|---|---|---|---|
| l. QWL | 0.74 | 0.55 | 78.73 | < 0.001 | |||||
| Constant | 6.98 | 35.16 | - | 5.03 | < 0.001 | ||||
| Spirituality WS | 0.076 | 1.28 | 0.725 | 16.96 | < 0.001 | ||||
| Marital status | 2.76 | 6.24 | 0.109 | 2.26 | 0.025 | ||||
| Number of children | 1.28 | -0.17 | -0.007 | -0.137 | 0.89 | ||||
| Employment status | 1.05 | 0.97 | 0.042 | 0.93 | 0.253 | ||||
| 2. Depression | 0.15 | 0.023 | 3.92 | 0.12 | |||||
| Constant | 4.055 | 13.48 | - | 3.32 | < 0.001 | ||||
| WS | -0.04 | -0.04 | -0.12 | -1.96 | 0.058 | ||||
| Age | -0.8 | -0.18 | -0.25 | -1.14 | 0.25 | ||||
| Work experience | 0.115 | 0.14 | 0.19 | 0.87 | 0.38 | ||||
| 3. Anxiety and insomnia | 0.33 | 0.111 | 16.04 | < 0.001 | |||||
| Constant | 1.77 | 21.67 | - | -0.25 | < 0.001 | ||||
| WS | 0.024 | 0.04 | 0.046 | -4.19 | < 0.001 | ||||
| Gender | 0.73 | -2.7 | -0.22 | -3.7 | < 0.001 | ||||
| 4. Social dysfunction | 0.35 | 0.125 | 12.08 | < 0.001 | |||||
| Constant | 1.51 | 4.14 | - | 2.74 | 0.006 | ||||
| WS | 0.017 | 0.09 | 0.315 | 5.34 | < 0.001 | ||||
| Age | 0.031 | 0.057 | 0.108 | 1.83 | 0.068 | ||||
| Ward | 0.065 | 0.12 | 0.109 | 1.86 | 0.064 |
The Results of the Logistic Regression Analysis to Predict General Health and Quality of Work Life
5. Discussion
This study examined the relationship of WS with GH and QWL among hospital nurses. Most participants were aged 24 - 34 years, and more than one-third had a work experience of 1 - 5 years, indicating that hospital nurses in the study setting were mostly young and relatively novice.
The findings showed that nurses had a moderate level of QWL. This result is consistent with previous studies conducted in Iran (26, 27), Nigeria (28), and Taiwan (29). In contrast, studies conducted in Nepal and Saudi Arabia reported that nurses' QWL was high (23, 30). These differences could be attributed to variations in work environments and the influence of personal, occupational, and psychological factors (31, 32).
Previous research has identified factors such as the number of monthly shifts, work style, level of support, job stress, and conflict with colleagues as effective contributors to the QWL among nurses (33, 34). Similarly, in the present study, a significant relationship was observed between demographic factors — such as employment status, marital status, and number of children — and QWL. Other studies have also confirmed the influence of individual and social factors on nurses’ QWL (23, 35).
A high QWL can enhance job performance and improve the quality of patient care, alongside having positive effects on nurses' well-being. Therefore, nursing managers should identify and address these factors within their work environments to improve the QWL for nurses.
Our findings showed that nurses perceived their work environment as relatively spiritual, with a mean score of 62.72 ± 14.30 out of 80. This finding is consistent with some previous studies (14, 19, 36). However, some studies reported higher levels of WS compared to the present study (13, 37). A high perception of a spiritual workplace encourages employees to be present in the workplace with their whole being — heart, spirit, mind, and body — and enhances psychological resources such as hope, optimism, and resilience (37). Developing a spiritual workplace fosters a sense of meaningful work, a sense of socialization, and a sense of coherence and consistency between life goals and career values. Therefore, it is recommended that nursing managers take necessary steps to promote WS.
Additionally, consistent with several other studies, WS showed a significant relationship with some demographic factors such as age, number of children, and employment status (38, 39). We also found that the dimensions of WS had a significant correlation with QWL and significantly predicted it. This finding aligns with the results of several previous studies (14, 36, 40, 41). Nurses who, at a personal level, are interested in engaging in activities that give meaning to their own and others’ lives tend to have greater interactions with their colleagues at the group level. They believe that individuals understand and support each other in their relationships, fostering subjective, emotional, and spiritual connections. At the organizational level, these nurses perceive that their organization values employee welfare and community, thereby experiencing a higher level of QWL (39, 40).
Therefore, nursing managers are recommended to attend to nurses’ personal needs and values, create a conscientious and supportive workplace environment, and encourage the internalization of spiritual values in the workplace to improve nurses’ QWL.
The findings of this study showed that, in terms of GH, nurses exhibited symptoms of health disorders, which had significant relationships with some demographic factors such as age, sex, department type, and work experience. This finding is consistent with previous studies conducted in Iran, and highlights that attention by nursing managers to the factors affecting nurses' health can help improve their well-being and enhance the quality of patient care (42).
The study findings also indicated a significant negative correlation between WS and the social dysfunction, anxiety and insomnia, and depression dimensions of GH. Furthermore, in line with other studies, a significant relationship was found between WS and demographic factors such as age, number of children, and marital status (43, 44).
Several reasons may explain these relationships. A spiritual workplace is associated with lower levels of job stress and burnout, and by increasing job satisfaction and emotional resilience, it can ultimately help reduce depression. A supportive work environment can also enhance sleep quality and patterns in nurses by fostering a greater sense of meaning and purpose in their work. Studies have shown that when nurses perceive their workplace to be spiritually supportive, they are more likely to engage in self-care practices that promote mental health and well-being. Nurses with a spiritual orientation at work perceive situations and events as less stressful, as spirituality acts as an alternative coping strategy in threatening situations, thereby helping them cope more effectively with occupational strains and experience a higher level of health (45-47).
On the other hand, this finding can be interpreted differently in the Iranian-Islamic culture, where spirituality is rooted in religion. In Islam, the nursing profession is considered a sacred profession. Therefore, by caring for patients and communicating with colleagues, nurses find meaning in their profession and cultivate inner spirituality, and in a way, align their inner beliefs with organizational values, which can have a positive impact on their mental health.
5.1. Conclusions
This study concludes that WS can significantly predict nurses’ GH dimensions and QWL. Therefore, nursing managers should employ strategies to promote spirituality in the workplace at both personal and organizational levels, allowing and encouraging nurses to experience WS and thereby give new meaning to their working life.
Examples of such strategies include job enrichment, job re-planning, staff development, making the workplace and nursing tasks more pleasurable, creating a friendly and supportive work environment, improving interpersonal relationships, and involving nurses in decision-making processes. These strategies can reduce nurses’ stress, facilitate the fulfillment of their social needs, promote acceptance of organizational goals and values, and ultimately improve their GH and QWL.
Future studies are recommended to replicate this research on larger samples of nurses and to explore the effects of potential mediators that may influence the relationship between WS, GH, and QWL.
5.2. Limitations and Strengths
The limitations of this study include the fact that, although the sample was representative of nurses in Khoy teaching hospitals, the findings may not be generalizable to all nurses in Iran or to nurses working in private hospitals. Additionally, data collection through the self-report method may have introduced recall bias. Despite these limitations, this study provides valuable evidence on the relationship between WS, GH, and QWL among nurses.
