


1. Background
2. Objectives
3. Methods
3.1. Cell Culture and Treatment
3.2. Cell Viability Assay
3.3. Colony Formation Assay
3.4. Wound Healing Assay
3.5. Cell Apoptosis and Cell Cycle Assays
3.6. Tumor Xenograft Mice Models
3.7. Western Blotting
3.8. Bioinformatics Analysis of the Molecular Mechanism Underlying Hedyotis diffusa Willd’s Inhibitory Effects on Cervical Cancer
3.9. High-Performance Liquid Chromatography-Mass Spectrometry
3.10. Determination of Total Flavonoid Content
3.11. Statistical Analysis
4. Results
4.1. Hedyotis diffusa Willd Exhibits Cytotoxic and Anti-migratory Effects on Cervical Cancer Cells
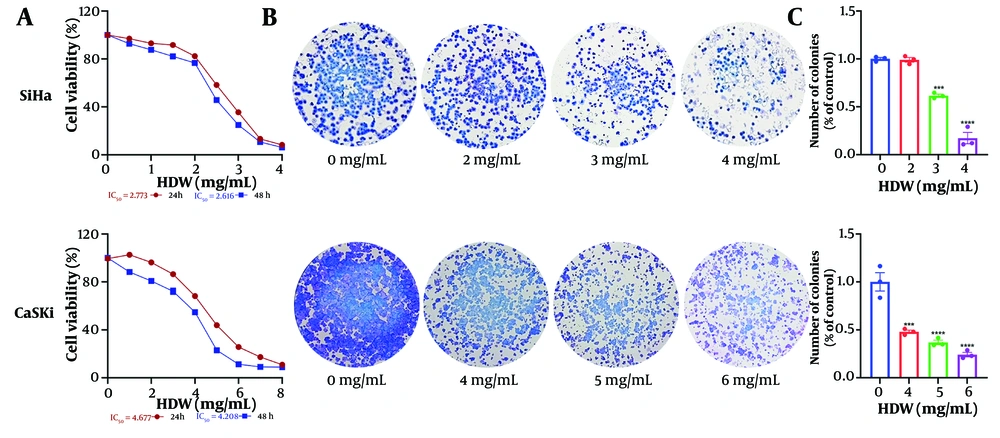
The effects of Hedyotis diffusa Willd (HDW) on cell survival and colony formation. A, the effects of HDW on cell survival, the horizontal axis is the concentration of HDW, and the vertical axis is cell viability. SiHa and CaSki cells were treated with various concentrations of HDW for 24 or 48 hours respectively, and its cell survival was estimated by CCK8 assays; B, the effects of HDW on colony formation, the dosage of 2, 3, and 4 mg/mL were used on SiHa cells (the upper) and dosage of 4, 5, and 6 mg/mL were used on CaSki cells (the lower) respectively, and the groups without HDW was set as the control; C, the histogram of colony formation assays. Statistical significance is indicated as follows: *** P < 0.001, and **** P < 0.0001.
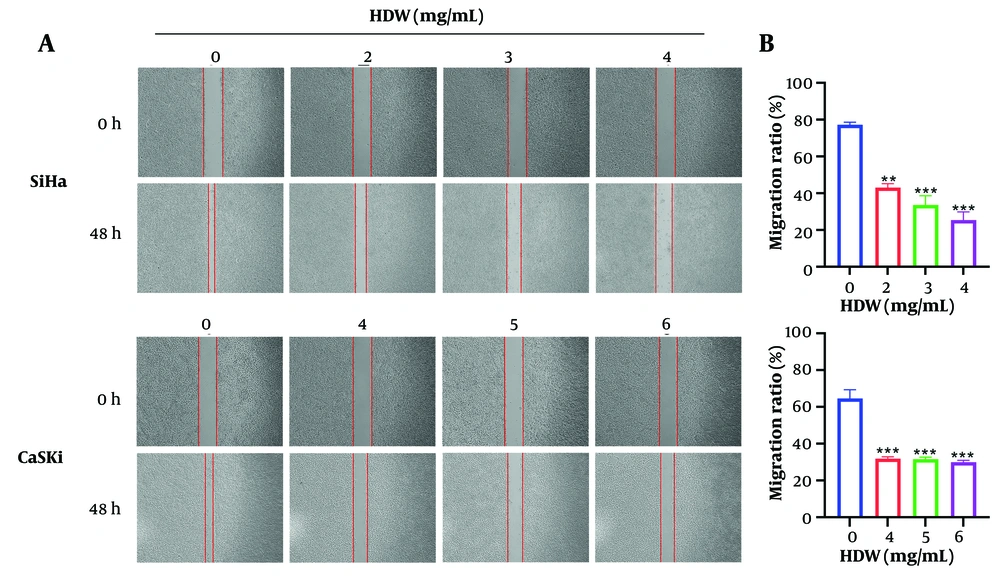
The effects of Hedyotis diffusa Willd (HDW) on cell migration. A, the images of scratches before and after using of HDW, the dosage of 2, 3, and 4 mg/mL were used on SiHa cells (the upper) and dosage of 4, 5, and 6 mg/mL were used on CaSki cells (the lower) respectively, and the groups without HDW was set as the control. The red vertical line is the edge location of the cell, and the width between the two vertical lines represents the scratch width; B, the histogram of cell migration assay. Statistical significance is indicated as follows: ** P < 0.01, and *** P < 0.001.
4.2. Hedyotis diffusa Willd Suppresses Tumor Growth in Mice
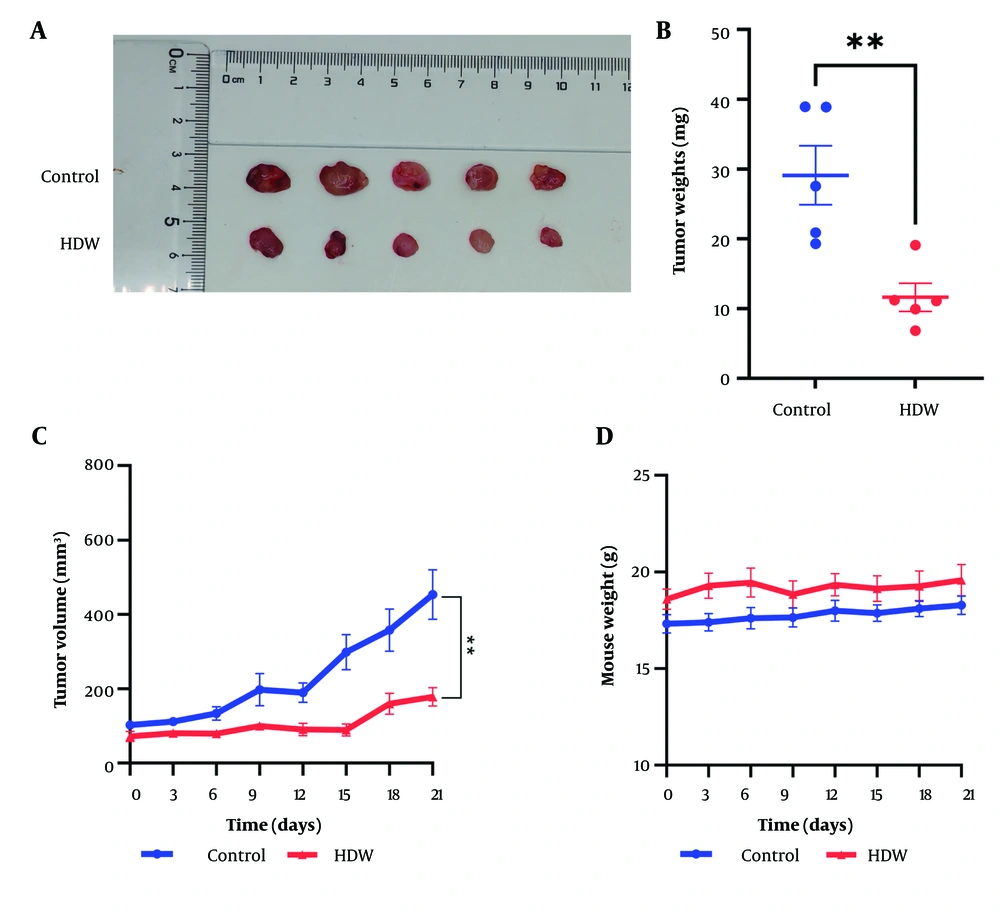
The effects of Hedyotis diffusailld (HDW) on tumor growth in Xenograft mice. A, the tumors from HDW-treated mice (the lower) and control mice; B, tumor weights of the control group (the blue dots) compare with the HDW-treated group (the red dots); C, tumor growth curve of the HDW-treated group (the red) and the control group (the blue); D, weights of mice of the HDW-treated group (the red) and the control group (the blue). Statistical significance is indicated as follows: ** P < 0.01.
4.3. Potential Molecular Mechanism of Hedyotis diffusa Willd’s Inhibitory Effects on Cervical Cancer
| Pubchem CID | Molecular Name | Targets |
|---|---|---|
| 5280343 | Quercetin | 121 |
| 10514946 | 2-methoxy-3-methyl-9,10-anthraquinon | 30 |
| 222284 | β-sitosterol | 26 |
| 5280794 | Stigmasterol | 24 |
| 5280863 | Kaempferol | 17 |
| 637542 | 4-Hydroxycinnamic acid | 13 |
| 135 | 4-Hydroxybenzoic acid | 12 |
| 72 | Protocatechuic acid | 8 |
| 445858 | Ferulic acid | 8 |
| 5280460 | Scopoletin | 3 |
| 5281330 | Poriferasterol | 2 |
| 11869658 | (4aS,6aR,6aS,6bR,8aR,10R,12aR,14bS)-10-hydroxy-2,2,6a,6b,9,9,12a-heptamethyl-1,3,4,5,6,6a,7,8,8a,10,11,12,13,14b-tetradecahydropicene-4a-carboxylic acid | 1 |
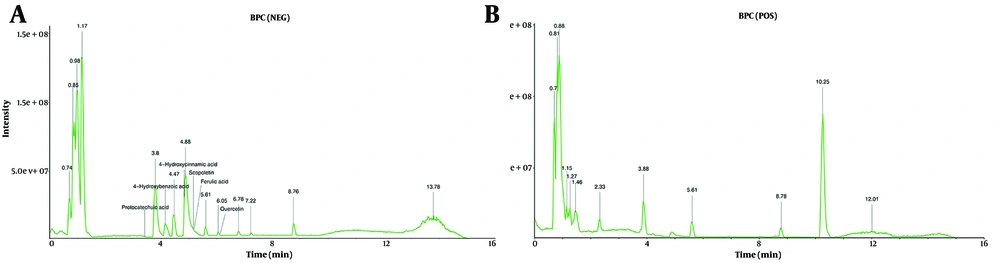
Base peak chromatograms (BPC) of the Hedyotis diffusa Willd (HDW) extract obtained by liquid chromatography-mass spectrometry (LC-MS) analysis. A, negative ionization mode; B, positive ionization mode. The active compounds of interest were annotated in the chromatograms.
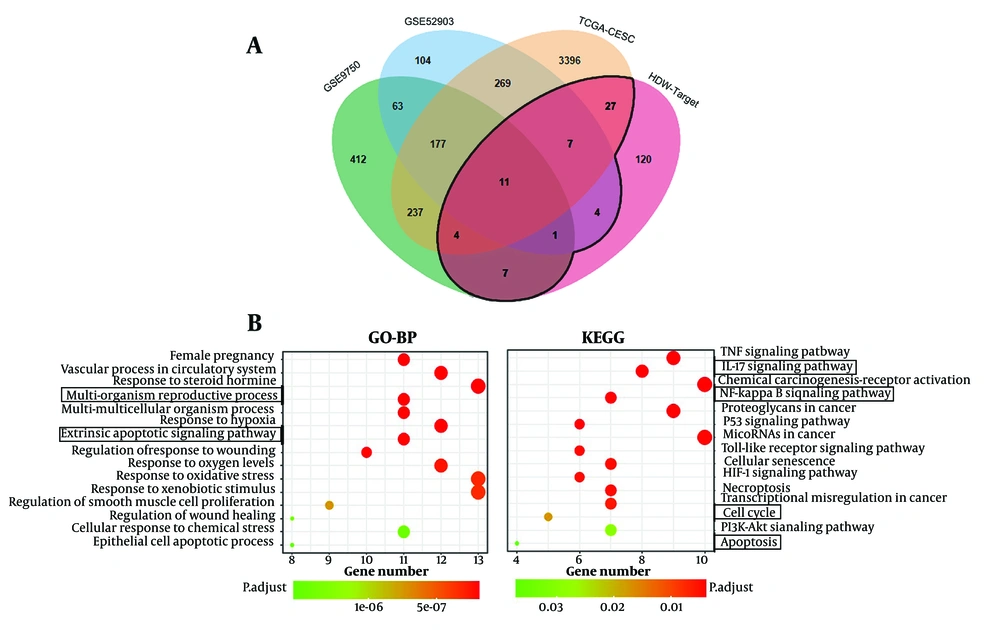
Enrichment analysis for the overlapping target genes of Hedyotis diffusa Willd (HDW) and cervical cancer. A, Venn diagram of the overlapping targets of HDW and CESC, the black line surrounds the intersecting genes; B, GO-BP enrichment analysis results showed that the multi-organism reproductive process and extrinsic apoptotic signaling pathway were significantly enriched. Kyoto Encyclopedia of Genes and Genomes (KEGG) enrichment analysis results showed that HDW may regulate IL-17, NF-κB, cell cycle and apoptosis signaling pathways in CESC.
4.4. Hedyotis diffusa Willd Induces Cell Apoptosis
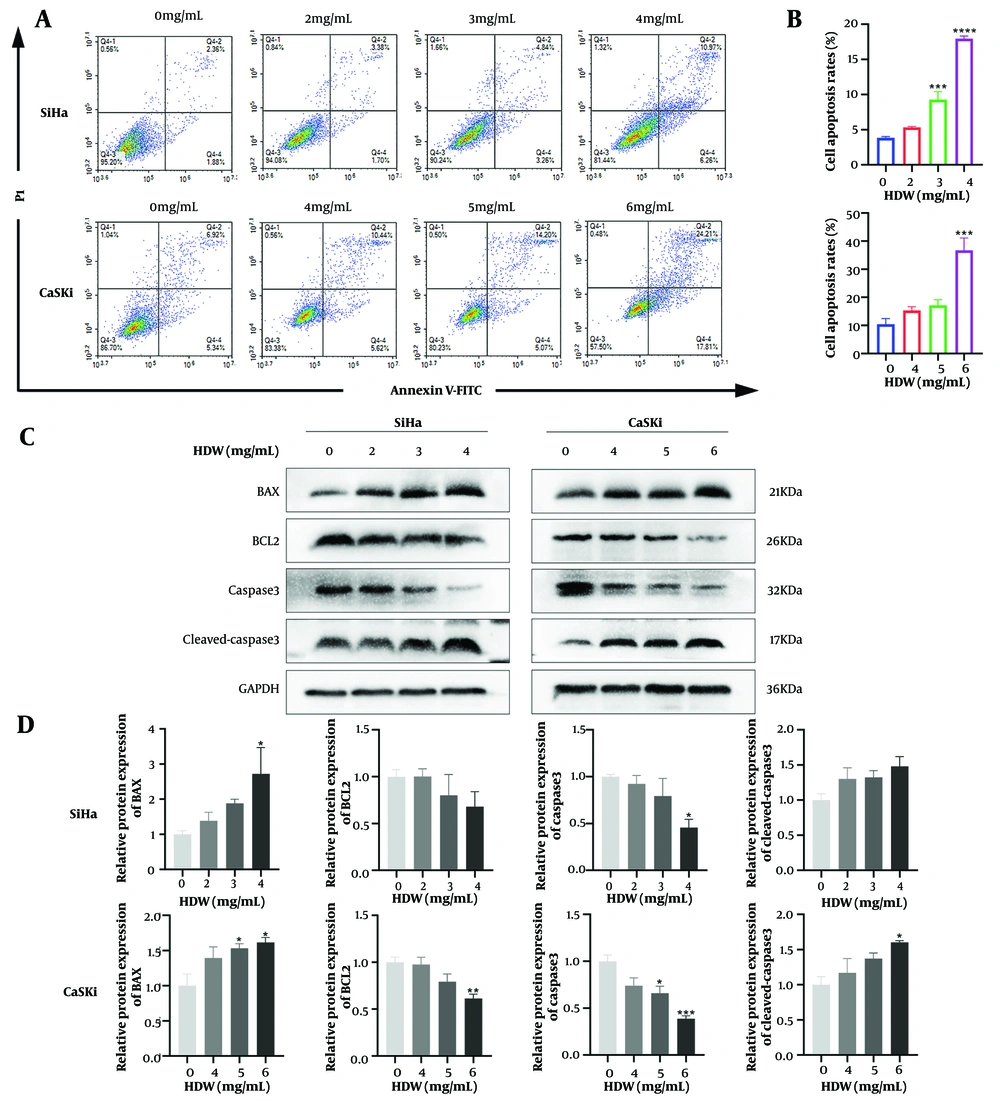
Hedyotis diffusa Willd (HDW) induces cell apoptosis. A, representative images of cell apoptosis after 48 hours of HDW treatment. SiHa cells were treated with HDW at concentrations of 2, 3, and 4 mg/mL (the upper), while CaSki cells were treated with 4, 5, and 6 mg/mL (the lower). Untreated cells served as the control group; B, quantitative histogram showing cell apoptosis rates across treatment groups; C, Western blot analysis of key apoptosis-related proteins; D, quantitative histogram of protein expression levels from Western blot analysis. (Abbreviations: PI, propidium iodide; BAX, Bcl-2-associated X protein; BCL2, B-cell lymphoma 2; caspase 3, cysteine-aspartic acid protease 3; cleaved-caspase 3, cleaved cysteine-aspartic acid protease 3; GAPDH, glyceraldehyde-3-phosphate dehydrogenase. Statistical significance is indicated as follows: * P < 0.05, ** P < 0.01, *** P < 0.001, and **** P < 0.0001.)
4.5. Hedyotis diffusa Willd Blocks the Cell Cycle in the S Phase
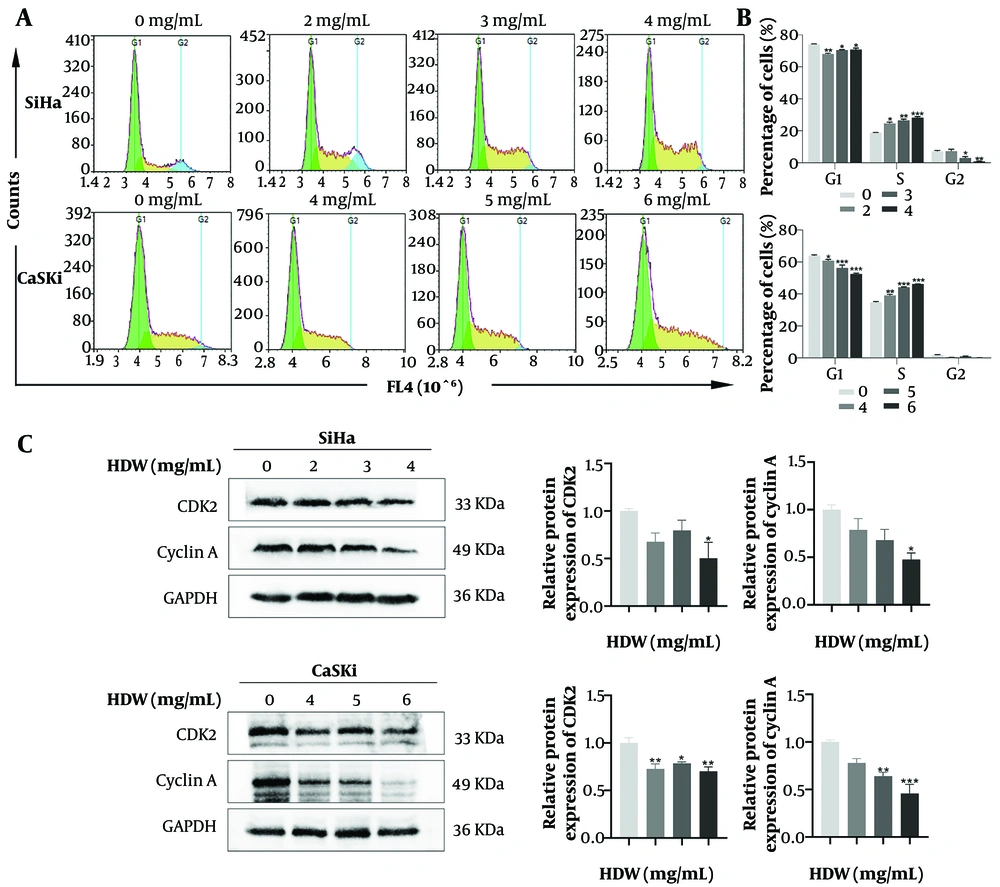
Effects of Hedyotis diffusa Willd (HDW) on the cell cycle. A, representative images showing cell cycle distribution after 48 hours of HDW treatment. Green represents the G1 phase, yellow represents the S phase, and blue represents the G2 phase; B, quantitative histogram of cell distribution across different cell cycle phases; C, Western blot analysis of key cell cycle regulatory proteins with quantitative histograms. (Abbreviations: CDK2, cyclin-dependent kinase 2; GAPDH, glyceraldehyde-3-phosphate dehydrogenase. Statistical significance is indicated as follows: * P < 0.05, ** P < 0.01, and *** P < 0.001.)
4.6. Hedyotis diffusa Willd Inhibits the IL-17/NF-κB Signaling Pathways
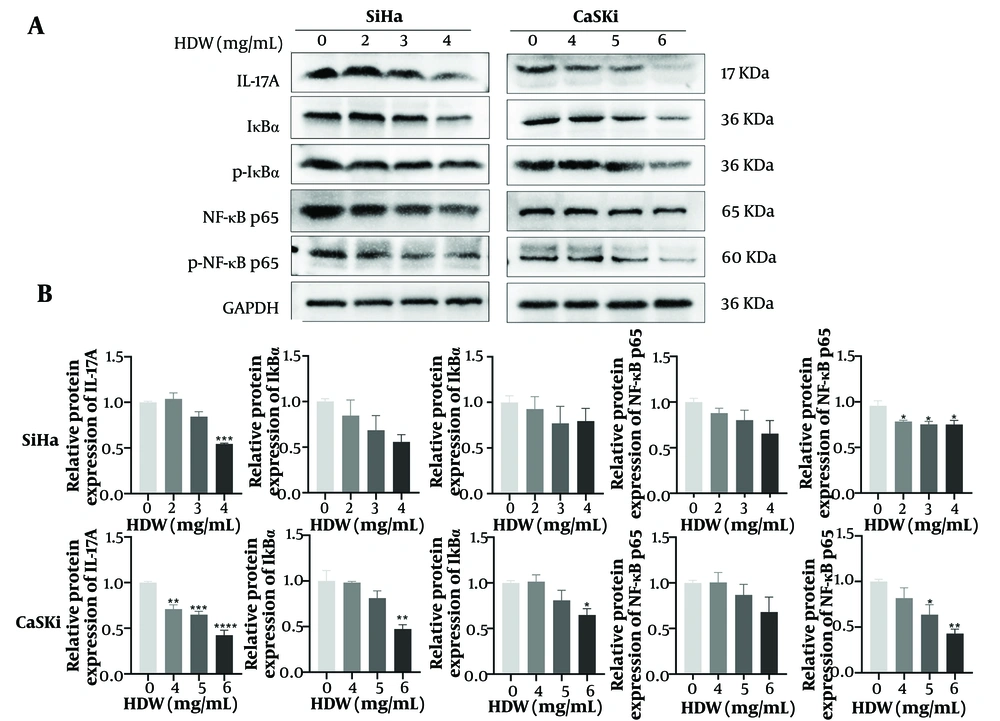
Effects of Hedyotis diffusa Willd (HDW) on the IL-17/NF-κB signaling pathway. A, western blot analysis of key proteins involved in the IL-17/NF-κB pathway; B, quantitative histogram of protein expression levels from Western blot analysis. (Abbreviations: IL-17A, interleukin 17A; IκBα, inhibitor of kappa B alpha; p-IκBα, phosphorylated Inhibitor of kappa B alpha; NF-κB p65, nuclear factor kappa B p65; p-NF-κB p65, phosphorylated nuclear factor kappa B p65, GAPDH, glyceraldehyde-3-phosphate dehydrogenase. Statistical significance is indicated as follows: * P < 0.05, ** P < 0.01, *** P < 0.001, and **** P < 0.0001.)





