


1. Background
Chronic Hepatitis B (CHB) and non-alcoholic fatty liver disease (NAFLD) are both liver illnesses that can disrupt liver function, causing severe liver complications and posing serious threats to human life (1). Due to urbanization, along with improvements in living standards and lifestyle changes, CHB + NAFLD is increasingly common in clinical practice. The global prevalence of hepatic steatosis in patients with Hepatitis B virus (HBV) infection has been reported to range from 14% to 70% (2, 3). Although HBV infection and hepatic steatosis can have a dual impact on the liver, whether they synergistically contribute to disease progression remains unclear. Notably, patients with concomitant NAFLD may have a higher clearance of Hepatitis B surface antigen (HBsAg) and HBV replication inhibition, leading to a higher probability of functional cure (4, 5). Conversely, some studies have suggested that NAFLD is an independent risk factor for fibrosis in CHB patients, especially those with severe steatosis accelerating hepatic fibrosis progression (6, 7).
Fibrosis is a common clinicopathologic characteristic in CHB + NAFLD patients. According to research, CHB + NAFLD patients with significant fibrosis/cirrhosis have a significantly increased risk of adverse liver outcomes (8, 9). Furthermore, advanced fibrosis is a vital predictor of antiviral therapy response and clinical prognosis in CHB patients (10). Therefore, besides aiding in the early identification of high-risk patients, accurate evaluation of the extent of advanced fibrosis and steatosis in CHB + NAFLD patients could help in developing appropriate therapeutic regimens for timely disease progression prevention.
Although liver biopsy is currently the gold standard for grading and staging liver histopathological severity, it cannot be employed as a routine screening tool due to its invasive nature and high risk of bleeding, among other biopsy-related complications. Consequently, the World Health Organization (WHO) recommends the use of serum biomarkers and transient elastography (TE) in assessing liver fibrosis in CHB patients (11). These approaches offer the advantages of being non-invasive and easy to perform. Serological indicators commonly used to monitor hepatic fibrosis include the aspartate aminotransferase (AST)-to-platelet (PLT) Ratio Index (APRI), the AST-to-alanine aminotransferase (ALT) ratio (AAR), Fibrosis Index based on the four factors (FIB-4), the glutamyl transpeptidase (GGT)-to-PLT ratio (GPR), S-Index, Forns Index, NAFLD fibrosis score (NFS), and the red blood cell distribution width-to-PLT ratio (RPR) (12, 13). Although these scoring systems have been validated in patients with chronic Hepatitis C (CHC), CHB, and NAFLD, it is noteworthy that their relevant parametric factors function differently in the context of dual etiology, resulting in their use not being as effective as expected (14, 15). Furthermore, the accuracy of TE in assessing hepatic fibrosis could be affected in patients with comorbid steatosis and obesity (16).
2. Objectives
Given the limitations of the aforementioned methods in diagnosing CHB + NAFLD, developing novel non-invasive diagnostic markers more suitable for assessing the degree of hepatic fibrosis and steatosis in CHB + NAFLD patients is imperative. Therefore, we retrospectively collected clinical data from patients diagnosed with CHB + NAFLD-associated hepatic fibrosis and steatosis via pathological examination of liver biopsy and analyzed the correlation of hepatic fibrosis/steatosis with single/multifactorial combination indicators and existing serological diagnostic models. In addition, we evaluated the indicators’ diagnostic performance and established a non-invasive diagnostic model that could be used to predict advanced fibrosis and moderate-to-severe steatosis, thus providing a strong diagnostic basis for clinical evaluation.
3. Methods
3.1. Patients
This retrospective study involved 99 CHB + NAFLD patients who were admitted to Shenzhen Third People’s Hospital between January 2017 and December 2020. The inclusion criteria were: (1) Patients with HBsAg positivity for > 6 months; and (2) patients with liver biopsy histology consistent with pathological changes of fatty liver disease. Patients with complications including other viral liver diseases, alcoholic liver disease, autoimmune liver disease, drug-induced Hepatitis, human immunodeficiency virus (HIV) infection, decompensated cirrhosis, malignancy, and pregnancy were excluded. All patients provided informed consent, and our ethics committee approved the study protocol on December 30, 2018 (approval No. 2018-014).
3.2. Liver Histopathology
Following ultrasonic localization to determine the puncture site and needle depth, liver tissue samples (1.0 - 2.0 cm in length) were obtained using a 16G puncture needle and fixed in a 10% formaldehyde solution. Subsequently, serial pathology sections were prepared and subjected to hematoxylin-eosin (HE) and fiber staining to establish the degree of inflammation, steatosis, and fibrosis. Two senior physicians examined the stained sections separately. Inflammation grading (G1 - G4) and fibrosis staging (S1 - S4) were performed using the Scheuer scoring system, with S ≥ 3 defined as advanced fibrosis and F ≥ 2 as moderate-to-severe steatosis involving > 20% of the cellular area.
3.3. Research Methods
The following patients’ clinical data were obtained from the hospital’s electronic medical record system: (1) Basic information (gender, age, height, and weight); (2) clinical grading and staging information (degree of fibrosis, steatosis, and inflammation); (3) routine blood tests [white blood cell (WBC) count, PLT count, and mean PLT volume (MPV)]; (4) Hepatic Function Index [ALT, AST, GGT, albumin (ALB), and alkaline phosphatase (ALP)]; (5) metabolism-related markers [glucose (GLU), cholesterol (CHOL), triglyceride (TG), total bilirubin (TB), direct bilirubin (DB), and uric acid (UA)]; (6) tumor markers [alpha fetoprotein (AFP)]; (7) four tests for liver fibrosis [procollagen III (PIIIP), hyaluronidase (HA), laminin (LN), and type IV collagen (CIV)]; and (8) HBV markers [HBV deoxyribonucleic acid (DNA) and HBsAg].
3.4. Calculation of Non-invasive Diagnostic Markers
Herein, AAR [AAR = [AST(U/L)]/ ALT(U/L)], APRI [APRI score = [AST(U/L)/ULN]/PLT(109/L) × 100], FIB-4 [FIB-4 score = [age (years) × AST(U/L)]/[PLT(109/L) × ALT(U/L)1/2], GPR [GPR score = [GGT(U/L)/ULN)/ PLT(109/L) × 100], Forns Index [Forns Index = 7.811 - 3.131 × ln[PLT(109/L)] + 0.781 × ln[GGT (U/L)] + 3.467 × ln[age(years)] - 0.014 × CHOL(mg/dL)], S-Index [S-Index = 1000*GGT(U/L)/ [PLT(109/L) × ALB(g/l)2], and NFS [NFS = -1.675 + 0.037 × age (years) + 0.094 × Body Mass Index (BMI; kg/m2) + 1.13 × impaired fasting glucose/diabetes (yes = 1, no = 0) + 0.99 × AST (U/L)/ALT(U/L) - 0.013 × PLT(109/L) - 0.66 × ALB(g/dL)] scores were determined. The diagnostic criteria for diabetes mellitus (DM) were: (1) A history of DM; or (2) a fasting glucose value ≥ 7.0 mmol/L; or (3) glucose levels ≥ 11.1 mmol/L in venous plasma at 2 h on a glucose tolerance test. Note: Upper limits of normal (ULN) of AST= 40 U/L; and ULN of GGT= 45 U/L.
3.5. Statistical Analysis
SPSS 26.0 and MedCalc 20.0 statistical software were used for statistical analysis. Normally distributed quantitative data were expressed as mean ± standard deviation (x ± s), and intergroup comparisons were performed using independent t-tests. Non-normally distributed quantitative data were presented as medians [interquartile ranges (IQR; P25 - P75)] and intergroup comparisons were performed using the Wilcoxon rank sum test. Qualitative data were expressed as relative numbers, with intergroup comparisons performed using the χ2 test. The correlation between bivariate variables was assessed using Spearman’s rank correlation method. Variables with varying P-values in the univariate analysis were included in the multivariate logistic regression analysis, and a forward likelihood ratio stepwise regression method was used to construct the risk prediction model. The diagnostic performance of the relative indicators was evaluated using receiver operating characteristic (ROC) curve analysis. Diagnostic accuracy was evaluated by calculating sensitivity, specificity, positive predictive value (PPV), and negative predictive value (NPV). The optimal cut-off value was determined using Youden’s Index, which represents the optimal combination of specificity and sensitivity. The DeLong test was used to compare the performance of different ROC curves. All tests were two-tailed, and results or differences with P < 0.05 were considered statistically significant.
4. Results
4.1. Patient Baseline Characteristics
Among the included CHB + NAFLD patients (mean age = 37.10 years), 87.9% were male, 99.0% had an inflammation grade ≤ 2, 30.3% had a steatosis grade ≥ 2, 36.4% had a fibrosis stage ≥ 3, 25.3% had normal ALT levels, 60.9% were HBeAg positive, and 59.1% had a BMI ≥ 25 kg/m2. A comparative analysis of the clinical data of patients with different fibrosis stages at baseline (Table 1) revealed statistically significant differences in age, UA, AFP, FIB-4, and Forns Index between the two groups (all P < 0.05), with the mean age, AFP level, FIB-4, and Forns Index of patients in the S ≥ 3 group being significantly higher than those in the S ≤ 2 group, while UA levels were significantly lower. The two groups showed no significant differences in other indicators at baseline (all P > 0.05).
| Descriptive Item | All Patients (n = 99) | S ≤ 2 (n = 63) | S ≥ 3 (n = 36) | t/Z/χ2-Value | P-Value |
|---|---|---|---|---|---|
| Gender (No. %) | χ2 = 0.054 | 0.816 | |||
| Male | 87 (87.9) | 55 (87.3) | 32 (88.9) | ||
| Female | 12 (12.1) | 8 (12.7) | 4 (11.1) | ||
| Inflammation grade (No. %) | χ2 = 0.577 | 0.447 | |||
| G ≤ 2 | 98 (99.0) | 62 (98.4) | 36 (100.0) | ||
| G ≥ 3 | 1 (1.0) | 1 (1.6) | 0 (0.0) | ||
| Steatosis grade (No. %) | χ2 = 3.158 | 0.076 | |||
| F < 2 | 69 (69.7) | 40 (64.5) | 29 (80.6) | ||
| F ≥ 2 | 30 (30.3) | 23 (36.5) | 7 (19.4) | ||
| Age (y; mean ± SD) | 37.10 ± 8.26 | 35.59 ± 7.98 | 39.75 ± 8.19 | t = 0.046 | 0.015 |
| < 30 | 17 (17.2) | 13 (20.6) | 4 (11.1) | χ2 = 1.461 | 0.227 |
| ≥ 30 | 82 (82.8) | 50 (79.4) | 32 (88.9) | ||
| ALT (U/L) | 53.0 (39.0 - 89.0) | 53.0 (41.0 - 89.0) | 50.5 (35.3 - 91.5) | Z = -0.040 | 0.968 |
| < 40 | 25 (25.3) | 14 (22.2) | 11 (30.6) | χ2 = 0.843 | 0.359 |
| ≥ 40 | 74 (74.7) | 49 (77.8) | 25 (69.4) | ||
| HBeAg (S/CO) | 4.75 (0.42 - 238.0) | 4.75 (0.56 - 1072.0) | 3.79 (0.39 - 157.9) | Z = -0.737 | 0.461 |
| Positive | 56 (60.9) | 35 (61.4) | 21 (60.0) | χ2 = 0.018 | 0.893 |
| Negative | 36 (39.1) | 22 (38.6) | 14 (40.0) | ||
| BMI (kg/m2) | 25.62 ± 3.08 | 25.50 ± 2.61 | 25.83 ± 3.82 | t = 4.510 | 0.681 |
| < 23 | 9 (13.6) | 5 (11.9) | 4 (16.7) | χ2 = 0.458 | 0.795 |
| 23 ~ 25 | 18 (27.3) | 11 (26.2) | 7 (29.2) | ||
| ≥ 25 | 39 (59.1) | 26 (61.9) | 13 (54.2) | ||
| WBC (109/L) | 6.32 (5.64 - 7.64) | 6.55 (5.65 - 8.24) | 6.24 (5.16 - 7.35) | Z = -1.749 | 0.080 |
| PLT (109/L) | 187.0 (146.0 - 210.0) | 189.0 (149.0 - 219.0) | 180.5 (133.5 - 194.5) | Z = -1.702 | 0.089 |
| MPV (fL) | 10.7 (10.1 - 11.4) | 10.7 (10.0 - 11.3) | 10.7 (10.2 - 11.8) | Z = -0.522 | 0.602 |
| AST (U/L) | 33.0 (26.0 - 48.0) | 32.0 (25.0 - 47.0) | 37.0 (27.3 - 50.3) | Z = -1.077 | 0.281 |
| GGT (U/L) | 36.0 (24.0 - 58.0) | 34.5 (24.0 - 54.3) | 40.0 (24.3 - 97.0) | Z = -0.888 | 0.374 |
| ALB (g/L) | 44.6 (42.4 - 46.9) | 44.6 (43.1 - 47.1) | 44.3 (40.8 - 46.8) | Z = -1.285 | 0.199 |
| ALP (U/L) | 80.5 (65.0 - 101.8) | 78.0 (64.5 - 99.0) | 83.0 (65.0 - 113.0) | Z = -0.856 | 0.392 |
| GLU (mmol/L) | 5.07 (4.63 - 5.44) | 5.13 (4.80 - 5.51) | 4.89 (4.54 - 5.30) | Z = -1.627 | 0.104 |
| CHOL (mmol/L) | 4.67 (4.05 - 5.31) | 4.82 (4.06 - 5.39) | 4.55 (4.01 - 5.09) | Z = -1.225 | 0.221 |
| TG (mmol/L) | 1.35 (0.91 - 1.97) | 1.46 (0.91 - 1.97) | 1.30 (0.92 - 2.12) | Z = -0.302 | 0.763 |
| TB (µmol/L) | 16.30 (12.61 - 20.62) | 16.76 (12.23 - 21.03) | 15.85 (13.13 - 19.60) | Z = -0.129 | 0.898 |
| DB (µmol/L) | 4.6 (3.6 - 5.6) | 4.6 (3.6 - 5.8) | 4.6 (3.9 - 5.4) | Z = -0.579 | 0.563 |
| UA (mmol/L) | 369.5 (320.8 - 418.0) | 377.5 (341.3 - 420.0) | 335.0 (281.5 - 393.3) | Z = -2.045 | 0.041 |
| AFP (ng/mL) | 3.69 (2.26 - 5.64) | 3.17 (2.07 - 5.16) | 4.48 (2.97 - 8.33) | Z = -2.396 | 0.017 |
| HA (ng/mL) | 76.27 (51.68 - 125.86) | 67.52 (43.78 - 116.09) | 99.58 (58.00 - 139.97) | Z = -1.647 | 0.100 |
| PIIIP (ng/mL) | 21.37 (18.06 - 25.81) | 21.28 (17.87 - 24.52) | 22.38 (18.07 - 30.88) | Z = -1.189 | 0.234 |
| CIV (ng/mL) | 21.04 (18.15 - 26.06) | 20.88 (18.03 - 23.53) | 21.80 (18.31 - 28.73) | Z = -1.046 | 0.296 |
| LN (ng/mL) | 32.77 (24.02 - 39.78) | 31.98 (21.10 - 37.67) | 33.43 (27.42 - 51.01) | Z = -1.586 | 0.113 |
| HBV DNA (log10, IU/mL) | 5.24 (3.01 - 7.63) | 4.70 (2.89 - 7.75) | 5.63 (3.64 - 7.29) | Z = -0.671 | 0.502 |
| HBsAg (IU/mL) | 3997.5 (1284.3 - 7350.3) | 4186.0 (1132.0 - 10108.6) | 3844.0 (1516.7 - 6831.5) | Z = -0.235 | 0.814 |
| AAR | 0.62 (0.50 - 0.82) | 0.61 (0.50 - 0.80) | 0.66 (0.47 - 0.89) | Z = -0.491 | 0.623 |
| APRI | 0.45 (0.33 - 0.85) | 0.43 (0.33 - 0.65) | 0.49 (0.40 - 0.92) | Z = -1.754 | 0.079 |
| FIB-4 | 0.95 (0.65 - 1.43) | 0.88 (0.60 - 1.20) | 1.08 (0.80 - 1.94) | Z = -2.313 | 0.021 |
| GPR | 0.48 (0.27 - 0.75) | 0.46 (0.25 - 0.68) | 0.57 (0.31 - 1.40) | Z = -1.762 | 0.078 |
| Forns Index | 4.69 (3.61 - 5.77) | 4.48 (3.30 - 5.47) | 5.15 (3.84 - 6.08) | Z = -2.237 | 0.025 |
| S-Index | 0.12 (0.06 - 0.19) | 0.10 (0.06 - 0.16) | 0.13 (0.07 - 0.39) | Z = -1.956 | 0.050 |
| NFS | 0.33 (-0.26 - 0.91) | 0.33 (-0.46 - 0.83) | 0.47 (-0.13 - 1.72) | Z = -1.113 | 0.266 |
Comparison of Baseline Data in Chronic Hepatitis B Combined with Non-alcoholic Fatty Liver Disease Patients with Different Fibrosis Stages a
4.2. Correlation of Single-Factor Indicators with Fibrosis Stage and Their Diagnostic Efficacy
Spearman’s rank correlation was used to analyze the relationship between fibrosis stage and indicators with P < 0.15 in the univariate analysis or previously established markers. According to the results (Table 2), fibrosis stage correlated significantly positively with age (r = 0.257, P = 0.010), AFP (r = 0.295, P = 0.015), FIB-4 (r = 0.234, P = 0.020), and Forns Index (r = 0.228, P = 0.025), and significantly negatively with UA (r = -0.262, P = 0.040). Additionally, the fibrosis stage correlated negatively with WBC, PLT, and GLU levels, and positively with HA, LN, APRI, and S Index, although the correlations were not significant (all P > 0.05). The performance of these unifactorial indexes in diagnosing fibrosis staging was further evaluated using ROC curves, revealing that the area under the curve (AUC) values of the indexes used to independently diagnose S ≥ 3 ranged between 0.600 and 0.670. At optimal cut-off values of 33.50 years, 7.63 × 10⁹/L, 198.0 × 10⁹/L, and 0.730 for age, WBC, PLT, and FIB-4, the sensitivities were found to be greater at 80.6%, 91.7%, 83.3%, and 83.3%, respectively. On the other hand, at optimal thresholds, UA, AFP, LN, GPR, S-Index, and NFS exhibited high specificity values of 97.6%, 89.7%, 89.5%, 83.9%, 90.2%, and 94.6%, respectively. Furthermore, age, WBC, PLT, and FIB-4 had high NPV values (> 80.0%), with only UA showing a better PPV value (88.9%).
| Descriptive Item | Spearman’s Rank Correlation | ROC Analysis | |||||||
|---|---|---|---|---|---|---|---|---|---|
| r-Value | P-Value | AUC (95% CI) | P-Value | Cut-off | Sensitivity (%) | Specificity (%) | PPV (%) | NPV (%) | |
| Age | 0.257 | 0.010 | 0.654 (0.542 - 0.767) | 0.011 | 33.5 | 80.6 | 47.6 | 46.8 | 81.1 |
| WBC | -0.177 | 0.080 | 0.606 (0.492 - 0.720) | 0.080 | 7.63 | 91.7 | 34.9 | 44.6 | 88.0 |
| PLT | -0.172 | 0.089 | 0.603 (0.489 - 0.717) | 0.089 | 198.0 | 83.3 | 42.9 | 45.5 | 81.8 |
| UA | -0.262 | 0.040 | 0.658 (0.498 - 0.818) | 0.041 | 302.05 | 36.4 | 97.6 | 88.9 | 74.1 |
| AFP | 0.295 | 0.015 | 0.673 (0.539 - 0.806) | 0.017 | 5.71 | 42.9 | 89.7 | 75.0 | 68.6 |
| GLU | -0.175 | 0.104 | 0.604 (0.479 - 0.728) | 0.104 | 4.795 | 44.1 | 77.4 | 55.6 | 68.3 |
| HA | 0.208 | 0.100 | 0.622 (0.480 - 0.764) | 0.100 | 76.27 | 65.4 | 60.5 | 53.1 | 71.9 |
| LN | 0.200 | 0.113 | 0.617 (0.475 - 0.759) | 0.113 | 40.82 | 38.5 | 89.5 | 71.4 | 68.0 |
| AAR | 0.050 | 0.626 | 0.530 (0.406 - 0.653) | 0.623 | 0.675 | 50.0 | 63.5 | 43.9 | 69.0 |
| APRI | 0.177 | 0.079 | 0.606 (0.490 - 0.723) | 0.080 | 0.395 | 77.8 | 44.4 | 44.4 | 77.8 |
| FIB-4 | 0.234 | 0.020 | 0.640 (0.527 - 0.754) | 0.021 | 0.730 | 83.3 | 41.3 | 44.8 | 81.3 |
| GPR | 0.179 | 0.228 | 0.607 (0.491 - 0.723) | 0.078 | 0.855 | 36.1 | 83.9 | 56.5 | 69.3 |
| Forns Index | 0.228 | 0.025 | 0.636 (0.522 - 0.750) | 0.025 | 4.755 | 63.9 | 61.3 | 48.9 | 74.5 |
| S-Index | 0.200 | 0.050 | 0.619 (0.502 - 0.736) | 0.051 | 0.295 | 30.6 | 90.2 | 64.7 | 68.8 |
| NFS | 0.146 | 0.269 | 0.587 (0.434 - 0.740) | 0.266 | 1.695 | 27.3 | 94.6 | 75.0 | 68.6 |
Spearman’s Rank Correlation and Receiver Operating Characteristic Analysis Between Single Factors and Fibrosis Stage
4.3. Correlation of Multifactorial Combined Indicators with Fibrosis Stage and Their Diagnostic Efficacy
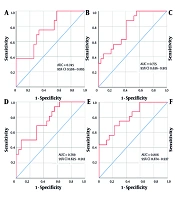
Single-factor indicators with P-values less than 0.05, 0.10, and 0.15 in the ROC analyses were combined based on whether they contained previously established non-invasive diagnostic markers (APRI, FIB-4, GPR, Forns Index, and S-Index), and then designated as "AUA, AUAFF, AUAWP, AUAFFWPAGS, AUAWPGHL, and AUAFFWPAGSGHL", respectively. The Spearman’s rank correlation analysis results suggested that these indicators were significantly positively correlated with the fibrosis stage (0.4 < r < 0.6, P < 0.01). Furthermore, ROC analysis of their diagnostic efficacy in patients with S ≥ 3 CHB + NAFLD showed that the AUC values increased to a 0.740 ~ 0.850 range (Figure 1). At the optimal threshold, AUAFF and AUAWP demonstrated higher specificity (92.6%) and sensitivity (87.5%) values, respectively. Furthermore, the diagnostic sensitivities of AUAWPGHL and AUAFFWPAGSGHL were 100% and 91.7%, respectively, with PPVs ranging from 60.0% to 75.0% and NPVs being > 90.0%. Moreover, DeLong’s test showed no significant difference in ROC curve performances for the multifactorial combined indicators across the different P-value classifications (all P > 0.05) (Table 3).
 curve analysis of multifactorial combinations predicting the risk of S ≥ 3 fibrosis in chronic Hepatitis B (CHB) combined with non-alcoholic fatty liver disease (NAFLD). A, AUA (age + UA + AFP); B, AUAWP (age + UA + AFP + WBC + PLT); C, AUAWPGHL (age + UA + AFP + WBC + PLT + GLU + HA + LN); D, AUAFF (age + UA + AFP + FIB-4 + Forns Index); E, AUAFFWPAGS (age + UA + AFP + FIB-4 + Forns Index + WBC + PLT + APRI + GPR + S-Index); and F, AUAFFWPAGSGHL (age + UA + AFP + FIB-4 + Forns Index + WBC + PLT + APRI + GPR + S-Index + GLU + HA + LN).")
Receiver operating characteristic (ROC) curve analysis of multifactorial combinations predicting the risk of S ≥ 3 fibrosis in chronic Hepatitis B (CHB) combined with non-alcoholic fatty liver disease (NAFLD). A, AUA (age + UA + AFP); B, AUAWP (age + UA + AFP + WBC + PLT); C, AUAWPGHL (age + UA + AFP + WBC + PLT + GLU + HA + LN); D, AUAFF (age + UA + AFP + FIB-4 + Forns Index); E, AUAFFWPAGS (age + UA + AFP + FIB-4 + Forns Index + WBC + PLT + APRI + GPR + S-Index); and F, AUAFFWPAGSGHL (age + UA + AFP + FIB-4 + Forns Index + WBC + PLT + APRI + GPR + S-Index + GLU + HA + LN).
| Descriptive Items | Spearman’s Rank Correlation | ROC Analysis | |||||||||
|---|---|---|---|---|---|---|---|---|---|---|---|
| r-Value | P-Value | AUC (95% CI) | P-Value | Cut-off | Sensitivity (%) | Specificity (%) | PPV (%) | NPV (%) | Z-Value b | P-Value b | |
| P < 0.05 | 0.627 | 0.531 | |||||||||
| AUA | 0.411 | 0.006 | 0.745 (0.596 - 0.895) | 0.008 | -0.484 | 68.8 | 70.4 | 57.9 | 79.2 | ||
| AUAFF | 0.450 | 0.002 | 0.769 (0.625 - 0.912) | 0.004 | 0.474 | 50.0 | 92.6 | 80.0 | 75.8 | ||
| P < 0.10 | 0.966 | 0.334 | |||||||||
| AUAWP | 0.461 | 0.002 | 0.775 (0.636 - 0.915) | 0.003 | -0.993 | 87.5 | 59.3 | 56.0 | 88.9 | ||
| AUAFFWPAGS | 0.512 | 0.000 | 0.806 (0.674 - 0.937) | 0.001 | -0.463 | 68.8 | 77.8 | 64.7 | 80.8 | ||
| P < 0.15 | 0.653 | 0.514 | |||||||||
| AUAWPGHL | 0.527 | 0.004 | 0.807 (0.649 - 0.966) | 0.006 | -1.526 | 100.0 | 50.0 | 60.0 | 100.0 | ||
| AUAFFWPAGSGHL | 0.590 | 0.001 | 0.844 (0.696 - 0.991) | 0.002 | -0.954 | 91.7 | 75.0 | 73.3 | 92.3 | ||
Diagnostic Efficacy Analysis of Multiple Indicator Combinations and Fibrosis Stage a
4.4. Correlation of Serological Markers with Steatosis Grade and Their Diagnostic Efficacy
Steatosis grading in CHB + NAFLD patients correlated positively with WBC, AST, ALB, and GLU, and negatively with MPV, LN, and HBeAg status, with only WBC, GLU, and LN exhibiting statistically significant correlation coefficients (all P < 0.05). The AUC values for these indicators’ use in diagnosing F ≥ 2 CHB + NAFLD ranged from 0.600 to 0.680, with high sensitivity (80.0%, 81.5%) and NPV (83.3%, 83.9%), especially when the critical values of ALB and GLU were 43.65 g/L and 4.81 mmol/L, respectively. Furthermore, LN had high specificity (83.7%) and NPV (81.8%) at an optimal cut-off value of 27.03 ng/mL. These indicators were further combined and designated as "WGL, WGLMA, and WGLMAAH" based on classifications of P-values less than 0.05, 0.10, and 0.15, respectively. The combinations correlated significantly positively with steatosis grading (0.28 < r < 0.45, all P < 0.05), and their AUC values for diagnosing F ≥ 2 increased to the 0.670 ~ 0.800 range (Figure 2). Furthermore, they all had good specificity (> 902890.0%) and high PPV and NPV (> 75%). According to DeLong'sDeLong’s test results, WGLMAAH showed a significantly better ROC curve performance than WGLMA (Z = 2.073, P = 0.038), and there were no significant differences between the two and WGL (all P > 0.05) (Table 4).
 curve analysis of multifactorial combinations predicting the risk of F ≥ 2 steatosis in chronic Hepatitis B (CHB) combined with non-alcoholic fatty liver disease (NAFLD). A, WGL (WBC + GLU + LN); B, WGLMA (WBC + GLU + LN + MPV + AST); and C, WGLMAAH (WBC + GLU + LN + MPV + AST + ALB + HBeAg status).")
Receiver operating characteristic (ROC) curve analysis of multifactorial combinations predicting the risk of F ≥ 2 steatosis in chronic Hepatitis B (CHB) combined with non-alcoholic fatty liver disease (NAFLD). A, WGL (WBC + GLU + LN); B, WGLMA (WBC + GLU + LN + MPV + AST); and C, WGLMAAH (WBC + GLU + LN + MPV + AST + ALB + HBeAg status).
| Descriptive Item | Spearman’s Rank Correlation | ROC Analysis | |||||||
|---|---|---|---|---|---|---|---|---|---|
| r-Value | P-Value | AUC (95% CI) | P-Value | Cut-off | Sensitivity (%) | Specificity (%) | PPV (%) | NPV (%) | |
| WBC | 0.293 | 0.003 | 0.684 (0.566 - 0.802) | 0.004 | 7.35 | 56.7 | 76.8 | 51.5 | 80.3 |
| MPV | -0.181 | 0.092 | 0.614 (0.481 - 0.747) | 0.092 | 10.45 | 53.8 | 67.7 | 41.2 | 77.8 |
| AST | 0.181 | 0.073 | 0.614 (0.493 - 0.735) | 0.073 | 39.50 | 53.3 | 72.5 | 45.7 | 78.1 |
| ALB | 0.162 | 0.113 | 0.601 (0.486 - 0.717) | 0.112 | 43.65 | 80.0 | 44.8 | 39.3 | 83.3 |
| GLU | 0.249 | 0.020 | 0.656 (0.534 - 0.777) | 0.021 | 4.81 | 81.5 | 43.3 | 39.3 | 83.9 |
| LN | -0.255 | 0.042 | 0.657 (0.504 - 0.809) | 0.043 | 27.03 | 61.9 | 83.7 | 65.0 | 81.8 |
| HBeAg status | -0.174 | 0.096 | - | - | - | - | - | - | - |
| WGL | 0.319 | 0.024 | 0.698 (0.533 - 0.862) | 0.025 | -0.32 | 56.3 | 79.4 | 56.3 | 79.4 |
| WGLMA a | 0.287 | 0.044 | 0.677 (0.506 - 0.849) | 0.045 | 0.034 | 43.8 | 94.1 | 77.8 | 78.0 |
| WGLMAAH a | 0.441 | 0.001 | 0.773 (0.620 - 0.926) | 0.002 | -0.224 | 62.5 | 91.2 | 76.9 | 83.8 |
Spearman’s Rank Correlation and Receiver Operating Characteristic Analysis Between Single/Multiple Factors Combinations and Steatosis Grade
5. Discussion
Although the HBV infection-related mortality rate has declined globally, hepatocellular carcinoma (HCC)-related deaths have increased by 25%, with age-standardized death rates attributable to non-alcoholic steatohepatitis (a severe form of NAFLD) and alcohol abuse increasing the fastest (17). According to research, NAFLD accounts for approximately 30% of HCC cases in developed countries (18). Furthermore, chronic HBV infection superimposed on NAFLD has demonstrated a growing trend in Asia (2). Comorbid fatty liver has also been established as an independent risk factor for fibrosis in CHB patients (7). Moreover, fibrosis has been most closely associated with long-term adverse events (8). These insights imply the increasing significance of the degree of fibrosis and steatosis in the prediction of clinical outcomes in CHB + NAFLD patients. Therefore, developing non-invasive diagnostic methods for assessing fibrosis and steatosis in CHB + NAFLD patients is essential.
In this study, CHB + NAFLD patients were mostly male and had a mild inflammatory grading (G ≤ 2). However, some patients already presented with varying degrees of hepatic tissue pathology despite having normal ALT levels, implying that aminotransferase levels may not sufficiently predict pathologic changes in liver tissues, aligning with prior reports (19). Our findings also showed that fibrosis staging in CHB + NAFLD patients correlated positively with age and AFP, and negatively with UA levels. Furthermore, the steatosis grading was positively correlated with WBC and GLU, but negatively correlated with LN. These findings are consistent with previous research, which showed that age, gender, BMI, glucose metabolism disorders, dyslipidemia, and UA are independent predictors of NAFLD complications in CHB patients (20). Our findings also align with another study from mainland China, which concluded that hyperuricemia correlated negatively with significant hepatic fibrosis (S ≥ 2), and that UA was a protective factor for significant hepatic injury in CHB + NAFLD patients (21). However, the precise mechanisms remain unclear, potentially due to limited relevant research. Moreover, there is currently no conclusive evidence on how CHB and NAFLD affect each other in a combined state.
In this study, the steatosis grading of CHB + NAFLD patients correlated negatively with LN, a marker of liver fibrosis, implying that comorbid NAFLD may reduce the degree of fibrosis. These findings align with prior studies indicating that lower fibrosis stages correlate with a higher risk of steatosis, while comorbid NAFLD may protect against significant hepatic fibrosis (22, 23). This phenomenon could also be attributed to the mild degree of steatosis in our study cohort (> 2/3 were grade F1). Moreover, HBV infection is negatively associated with blood lipid profiles, and its metabolic modifications might prevent the progression of fatty liver (24). Evidence from recent studies has shown that persistent severe hepatic steatosis may be positively associated with fibrosis progression (6, 25). Overall, the interaction between CHB and NAFLD in a combined state remains largely unclear, necessitating significant additional research.
In this study, relevant unifactorial indicators and existing serological diagnostic models demonstrated low diagnostic value for detecting advanced fibrosis and moderate-to-severe steatosis in CHB + NAFLD patients, with AUCs ranging from 0.600 to 0.680. Our findings are consistent with previous studies in CHB + NAFLD patients, which demonstrated comparable diagnostic performance for advanced fibrosis: FIB-4 (AUC = 0.67), APRI (0.60), and NFS (0.65) (10). Compared to single serologic indicators, existing serologic models showed comparable accuracy in diagnosing advanced fibrosis, but significantly inferior effectiveness in diagnosing CHC, CHB, and NAFLD, possibly influenced by the dual etiologic background. According to recent research, chronic liver diseases of different etiologies have different pathogenesis and fibrosis patterns, necessitating different systems for fibrosis evaluation (26, 27). Although their diagnostic accuracy was not high, at the optimal threshold, some indicators such as age, WBC, PLT, and FIB-4 had sensitivity values > 80.0%. At the same time, the specificity values of UA, AFP, LN, S-Index, and NFS were near or above 90.0%. These findings suggest that the aforementioned indicators have a better role in identifying or excluding significant fibrosis.
We also found that the PPVs of existing serologic models for diagnosing significant fibrosis were generally low, with all PPVs being < 50.0%, except for those of GPR, S-Index, and NFS. Indeed, low PPV is a common problem with non-invasive liver fibrosis models and, as per the WHO-issued HBV guidelines, all non-invasive tests currently used to diagnose liver fibrosis and cirrhosis are considered to have a low PPV (< 50.0%) (11, 28). We further integrated different commonly used and serologic indicators in a multifactorial combination, yielding improved AUC and PPV values, with AUAWPGHL and AUAFFWPAGSGHL showing the highest sensitivity for diagnosing S ≥ 3 fibrosis. On the other hand, the specificity was reduced probably due to the involvement of multiple indicators susceptible to various factors. Furthermore, the multifactor combination indicators in different P-value categories showed no significant differences in ROC curve performances, implying that using combinations containing established non-invasive diagnostic markers may yield no significant advantage. Moreover, we found that the multifactorial combination used to diagnose moderate-to-severe steatosis had an AUC value of about 0.700 or more, as well as high specificity, PPV, and NPV, highlighting its usefulness in excluding obvious steatosis. A study evaluating noninvasive diagnostics for NASH with significant fibrosis reported AUC values of 0.739 (FibroScan-AST), 0.754 (LSM), 0.643 (NFS), and 0.665 (FIB-4) (29). However, few investigations have explored novel serological markers for fibrosis and steatosis assessment in CHB + NAFLD patients.
Overall, we developed predictive models for advanced fibrosis and moderate-to-severe steatosis in CHB + NAFLD patients using common clinical parameters. Although these models demonstrated significant superiority over previously established non-invasive diagnostic markers, they could not achieve both high sensitivity and specificity. This study has inherent limitations, including its retrospective, single-center nature and modest sample size, which may affect the statistical power and generalizability of the results. Further investigations are warranted to discover and validate optimized biomarkers for precise disease stratification in these patients. Nonetheless, this study crucially informs the establishment of non-invasive diagnostic indicators for liver fibrosis and steatosis, and the resulting models could be useful in diagnosing diseases in resource-limited areas.
